Assess Any Site
in Australia
Interactive map with 130+ data layers. 8 property scores per address. Feasibility calculator with AI analysis. 840K+ development application leads.
One Platform, Three Tools
Everything you need to research, assess, and act on property opportunities.
Interactive Map
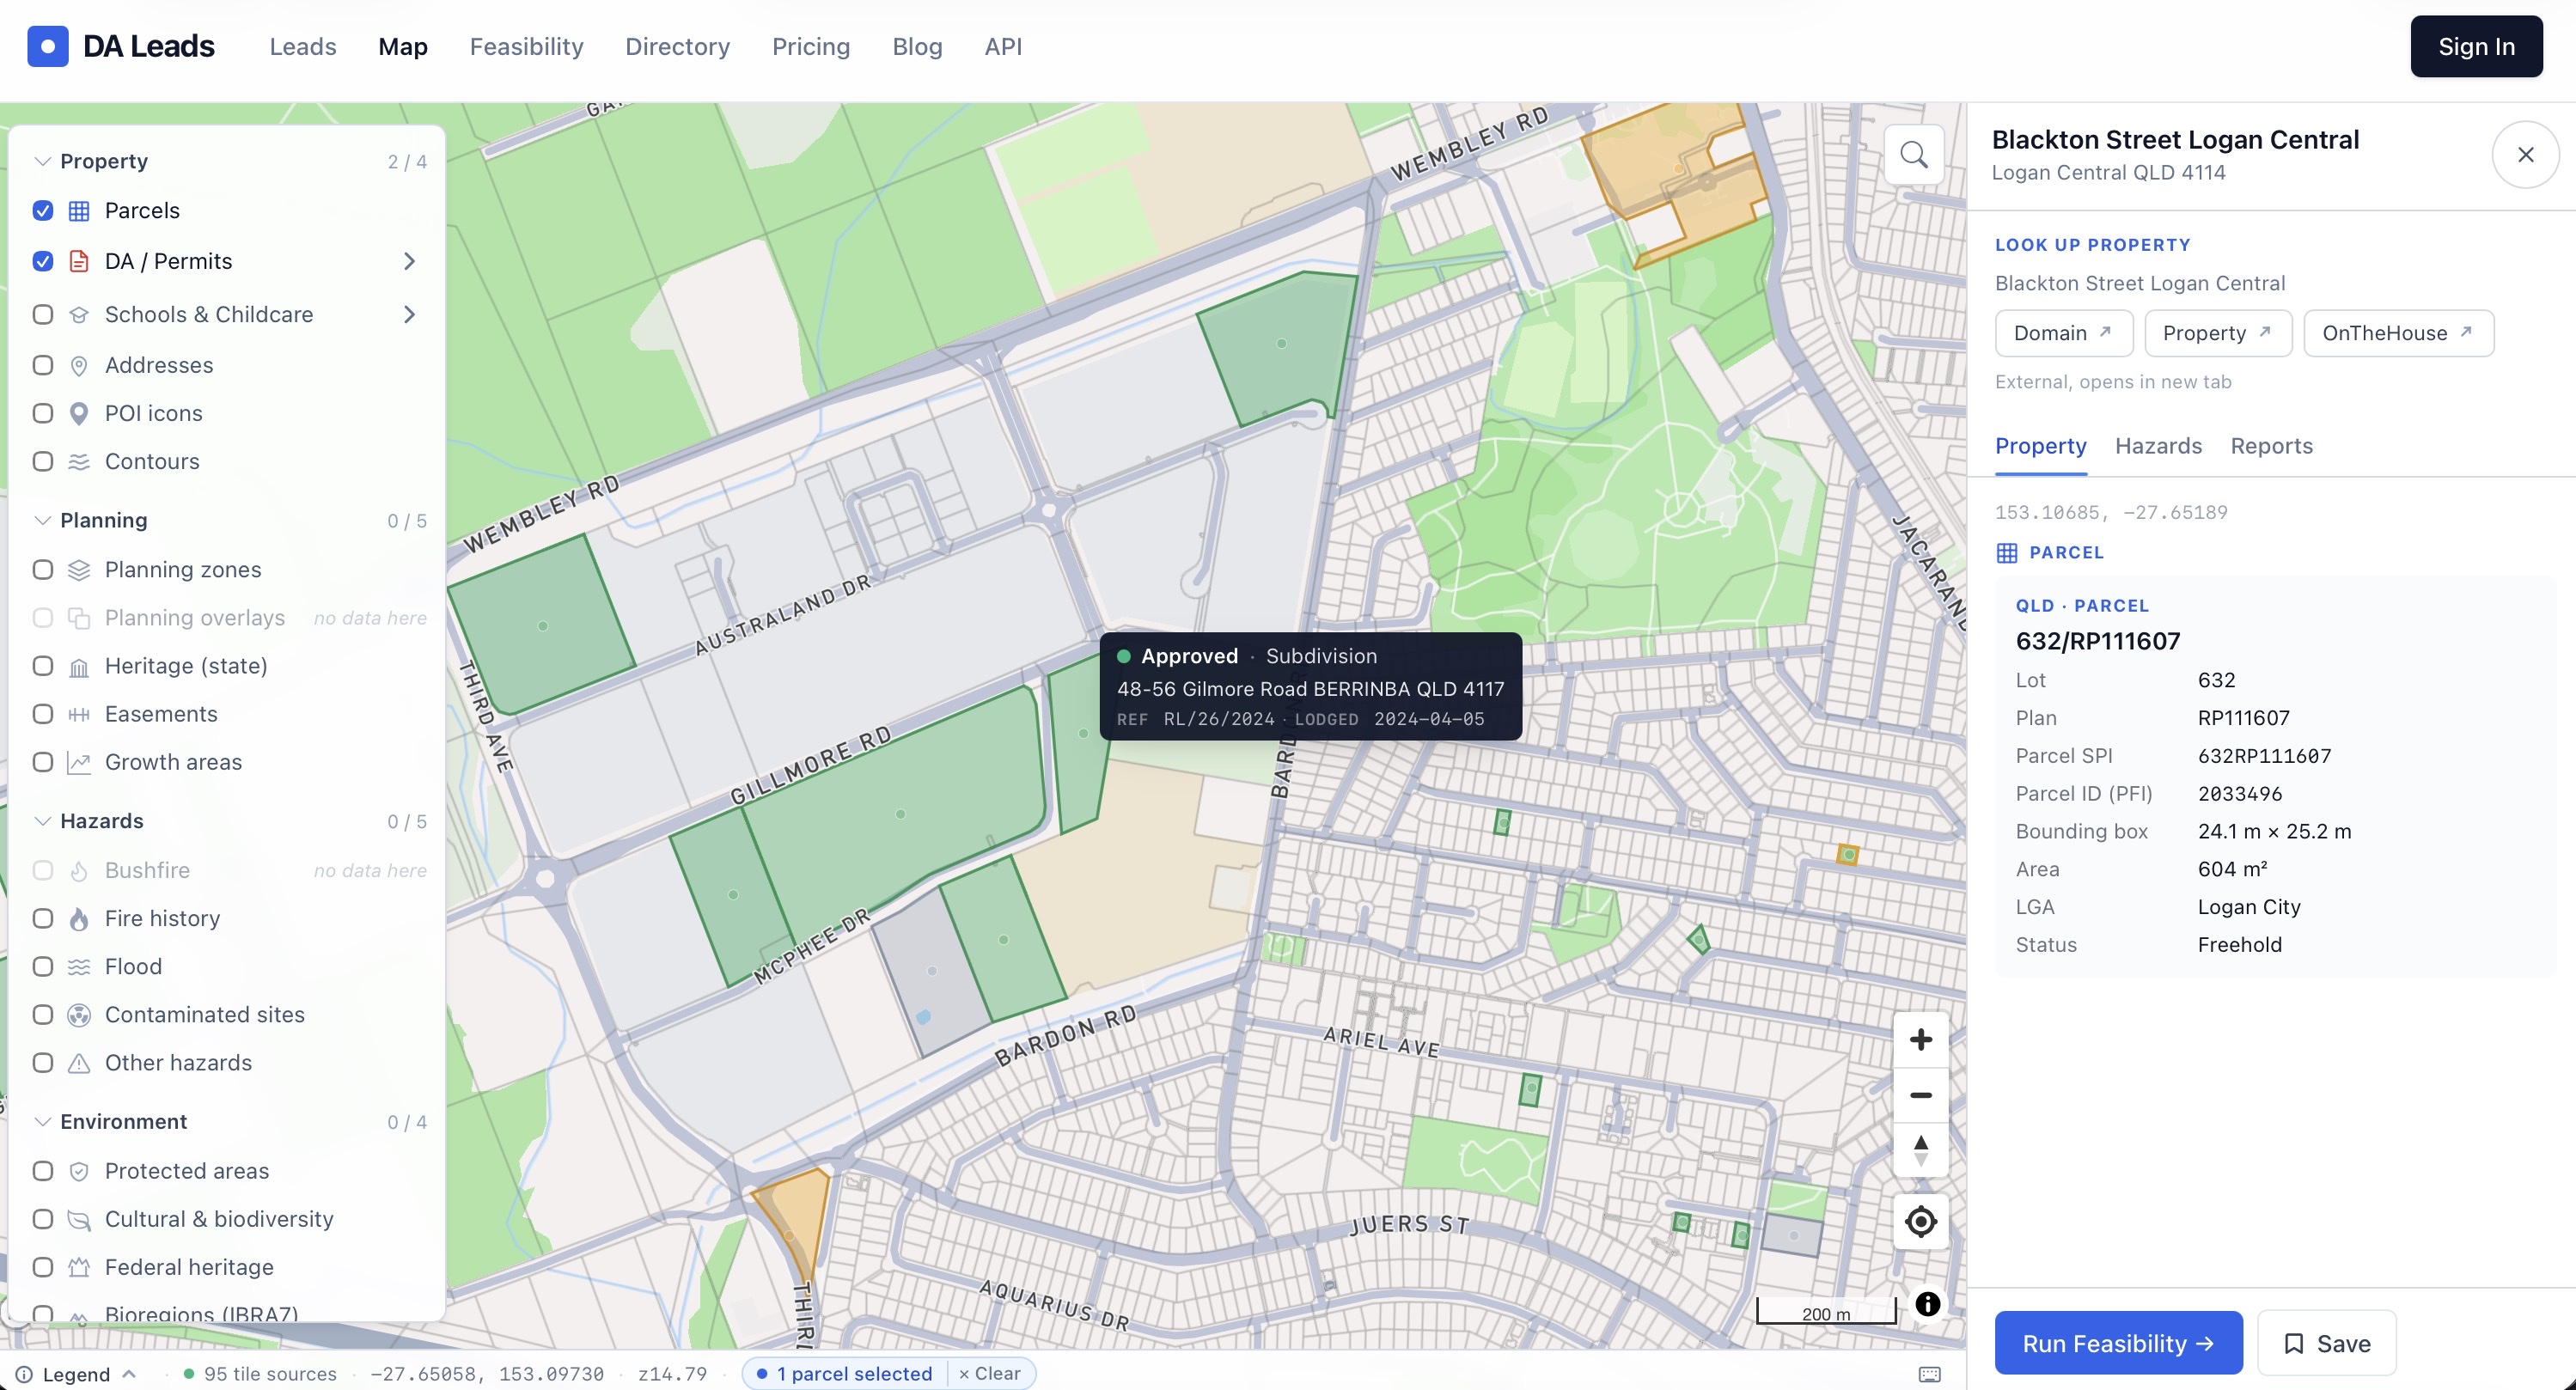
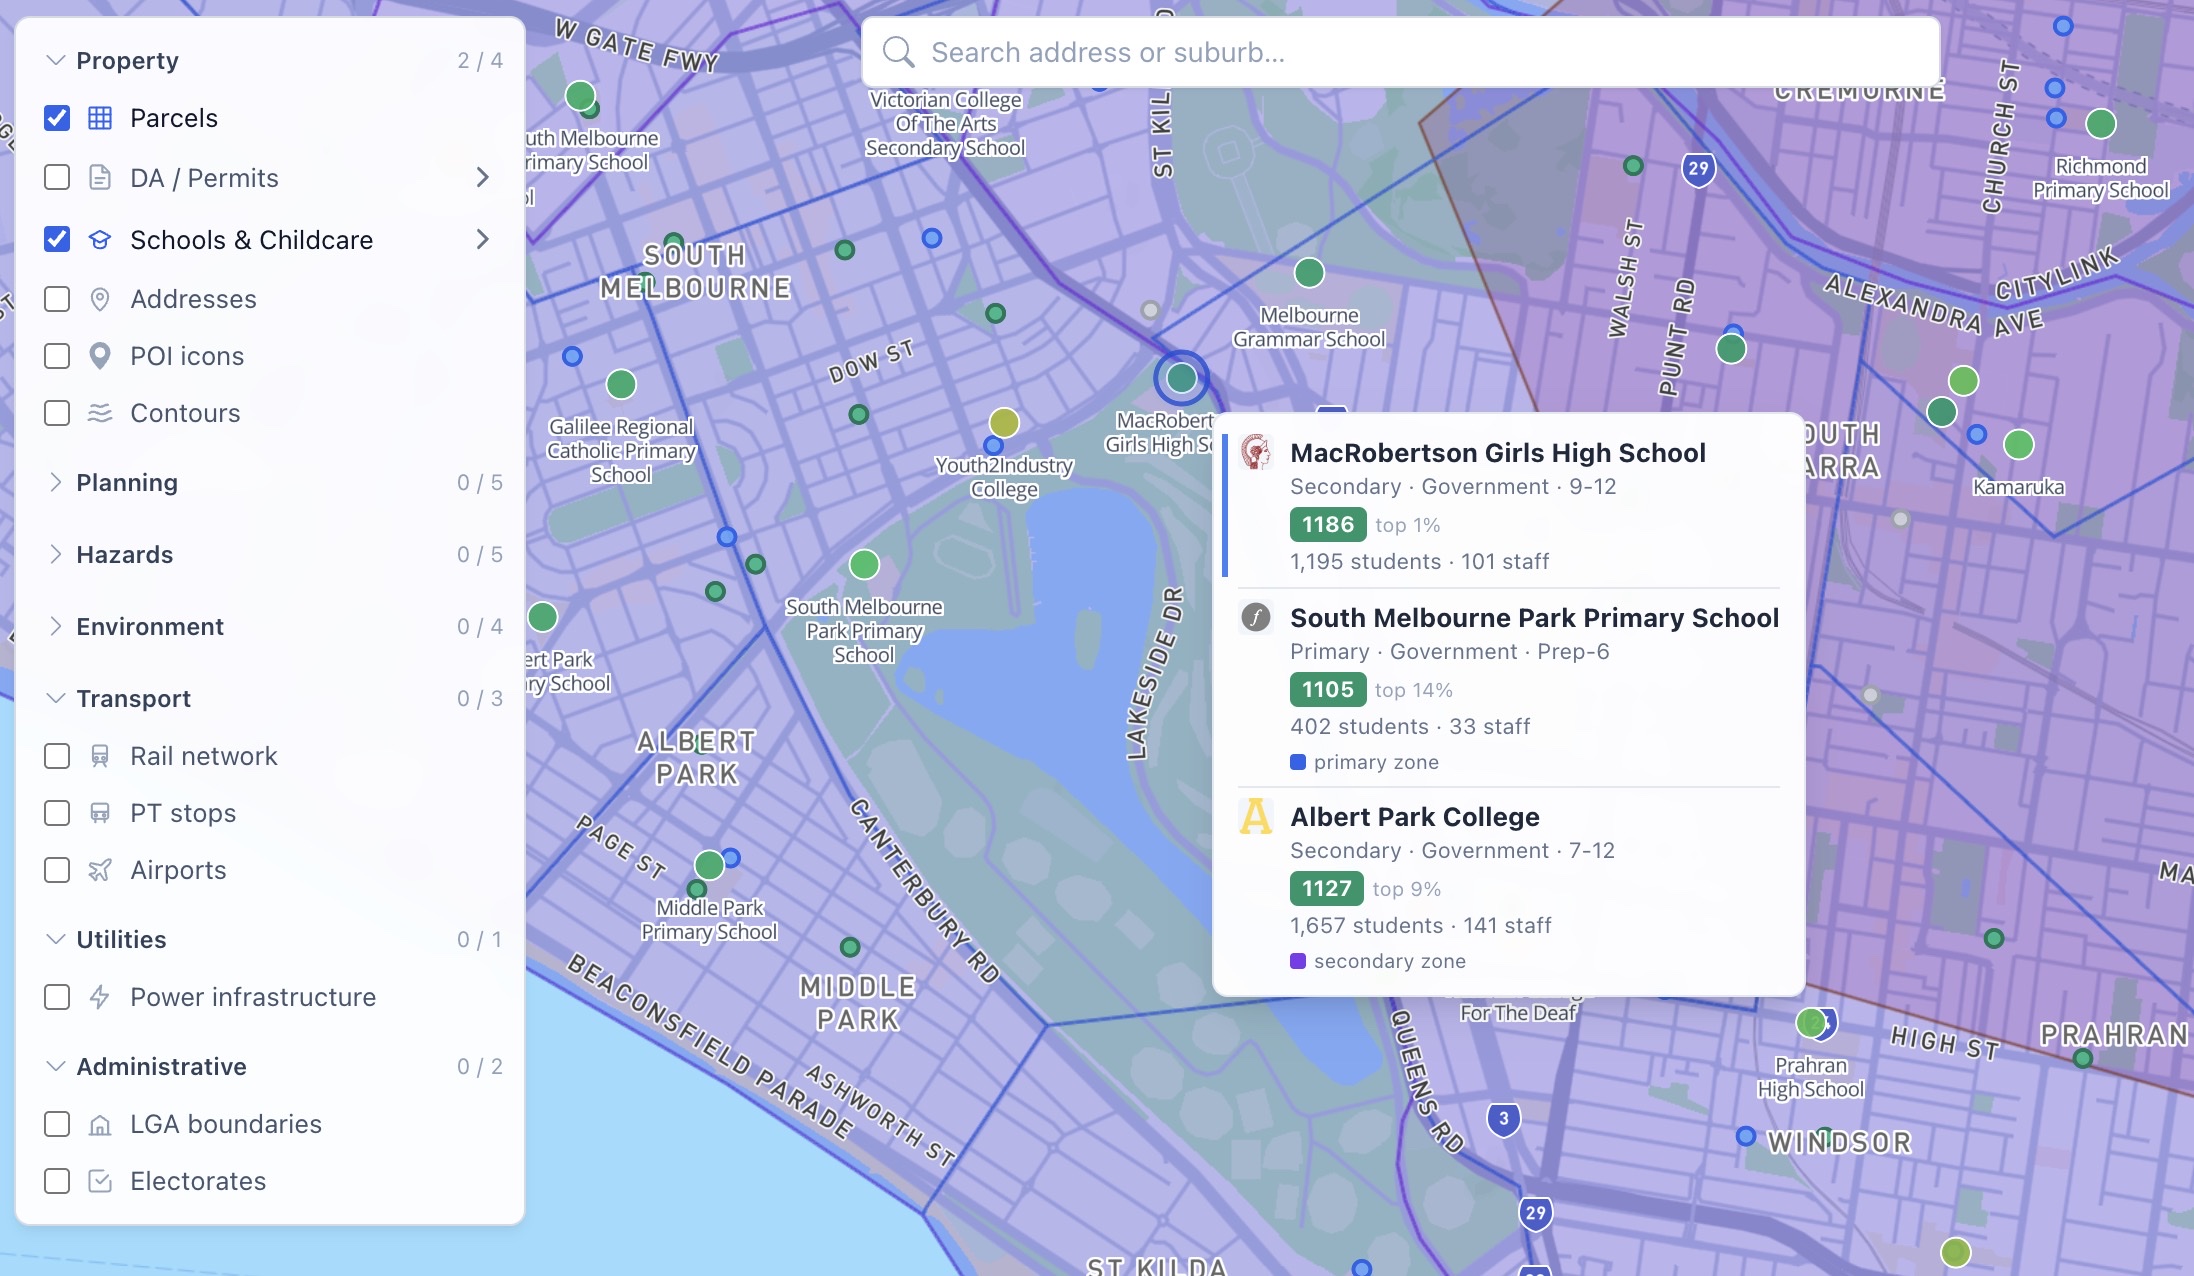
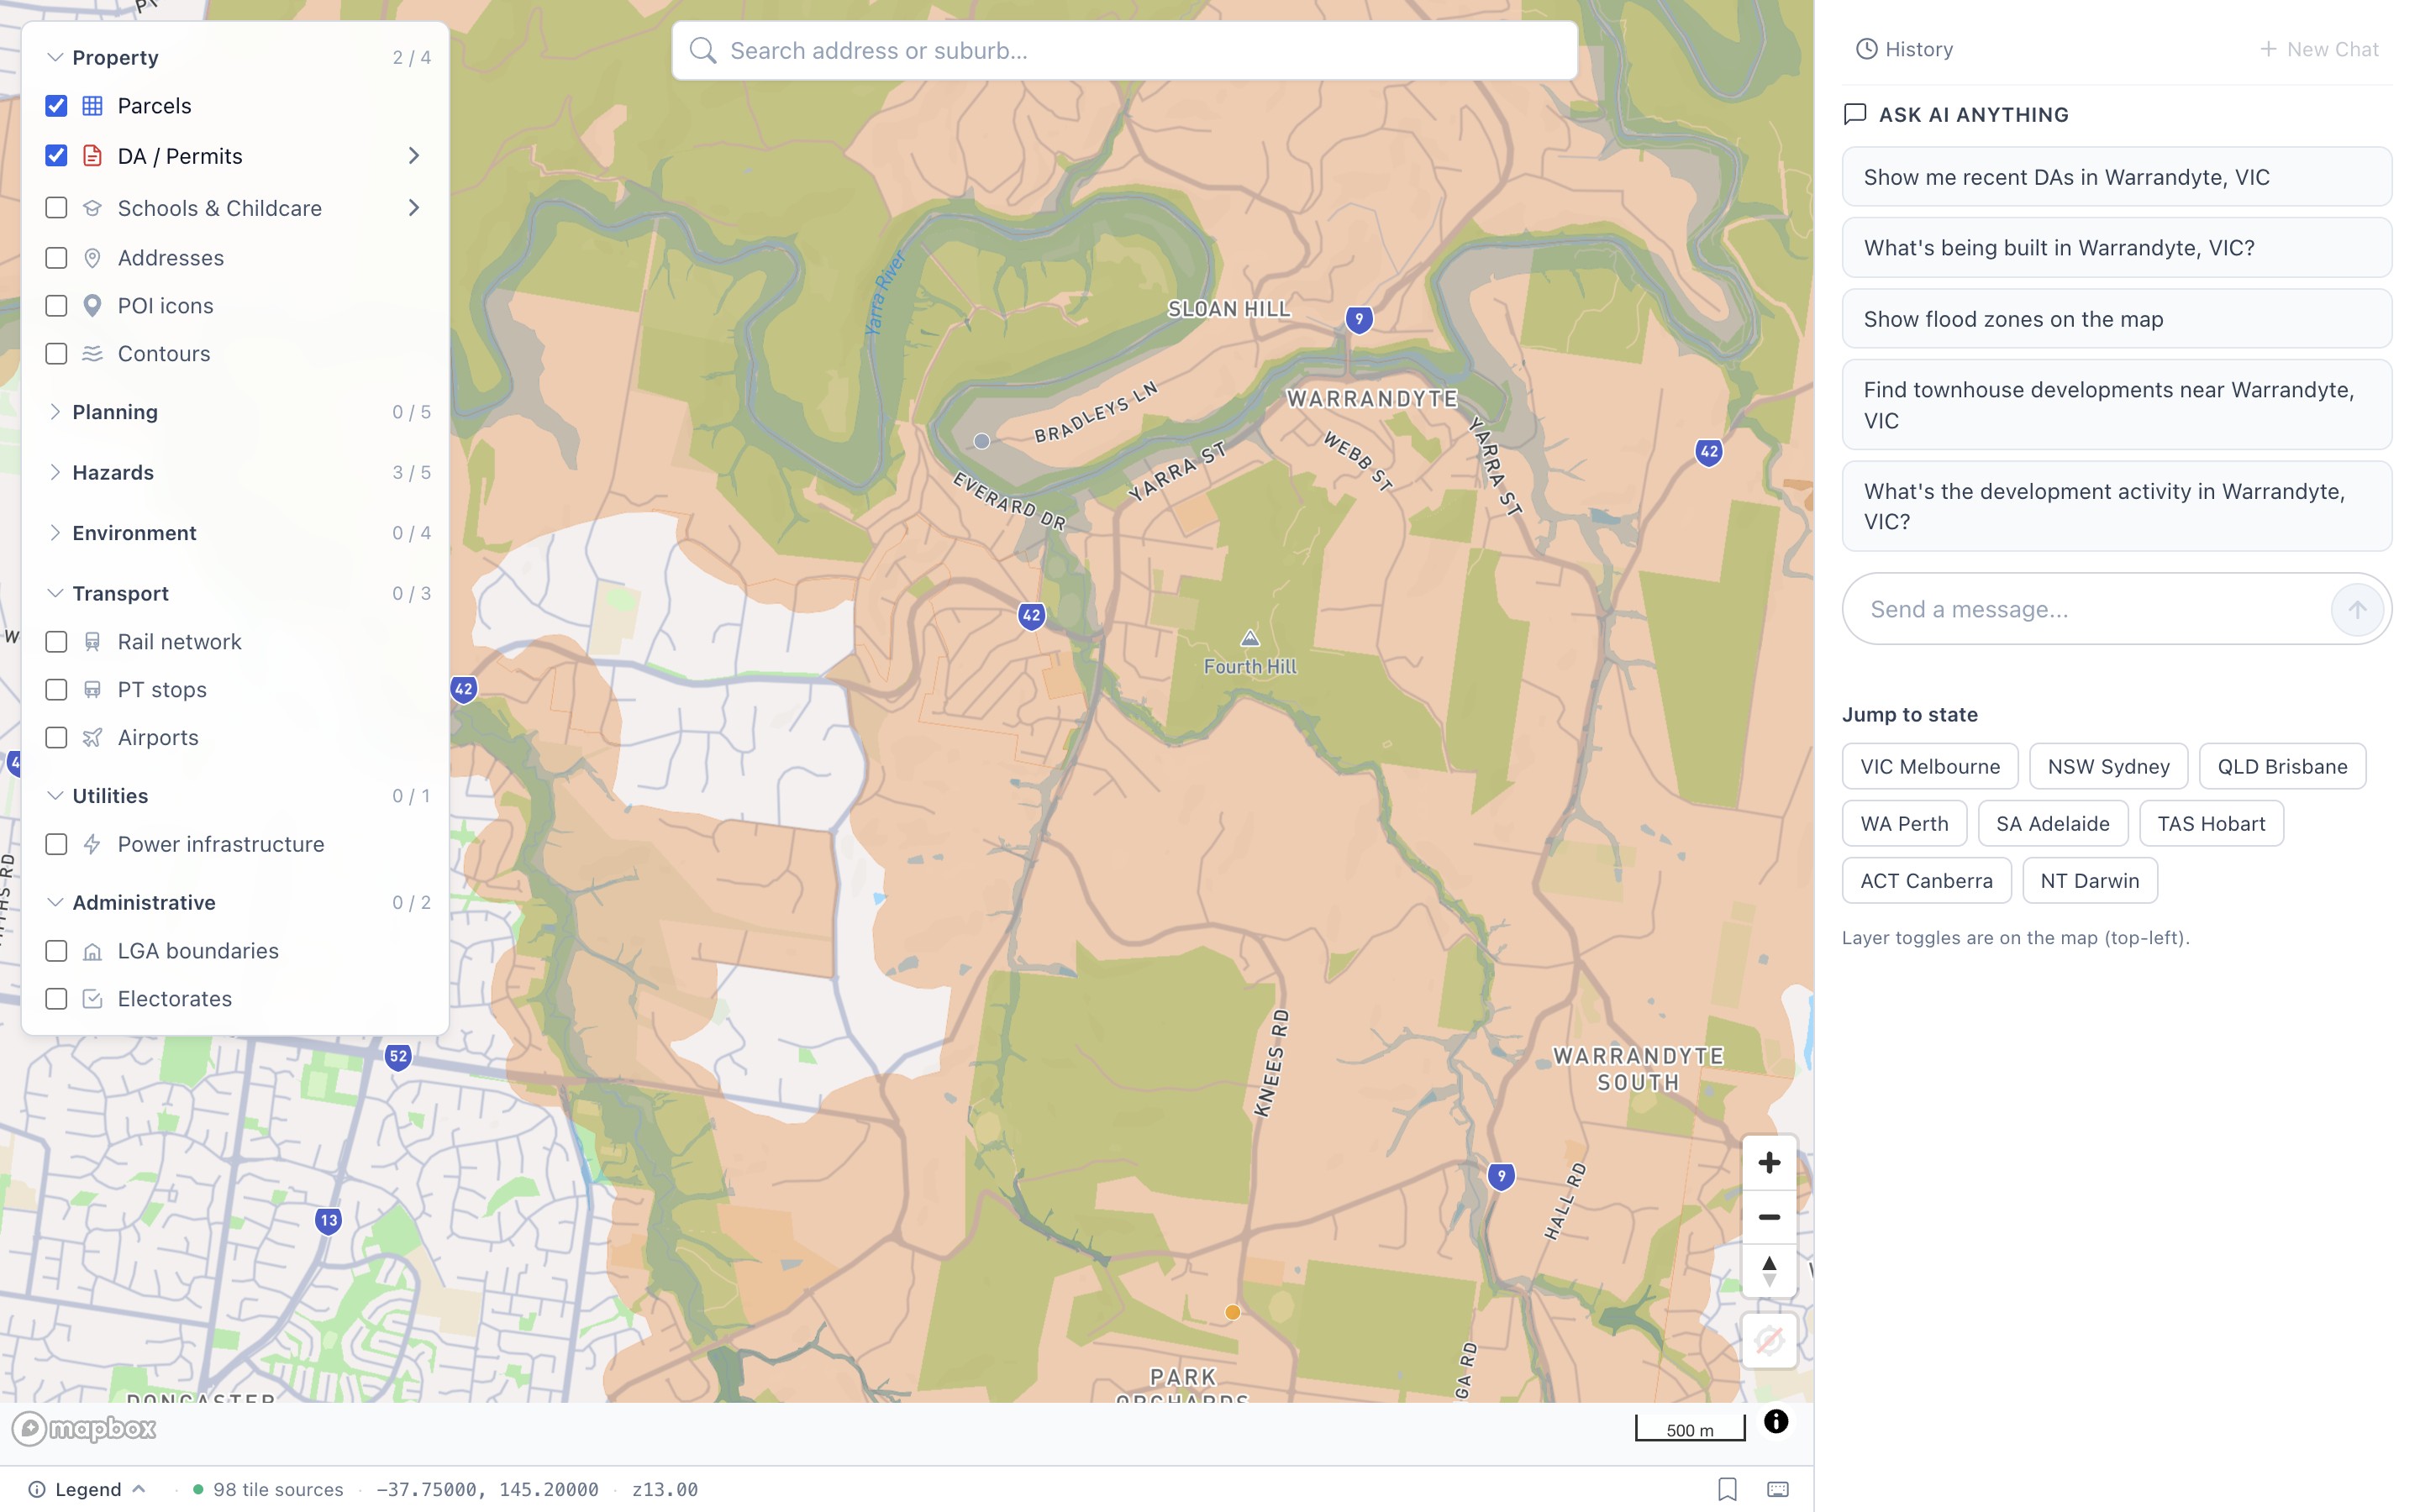
130+ data layers. Zoning, overlays, flood maps, bushfire zones, parcels, nearby DAs, schools, and more. Click any parcel for instant site intelligence.
Open Map →8 Property Scores
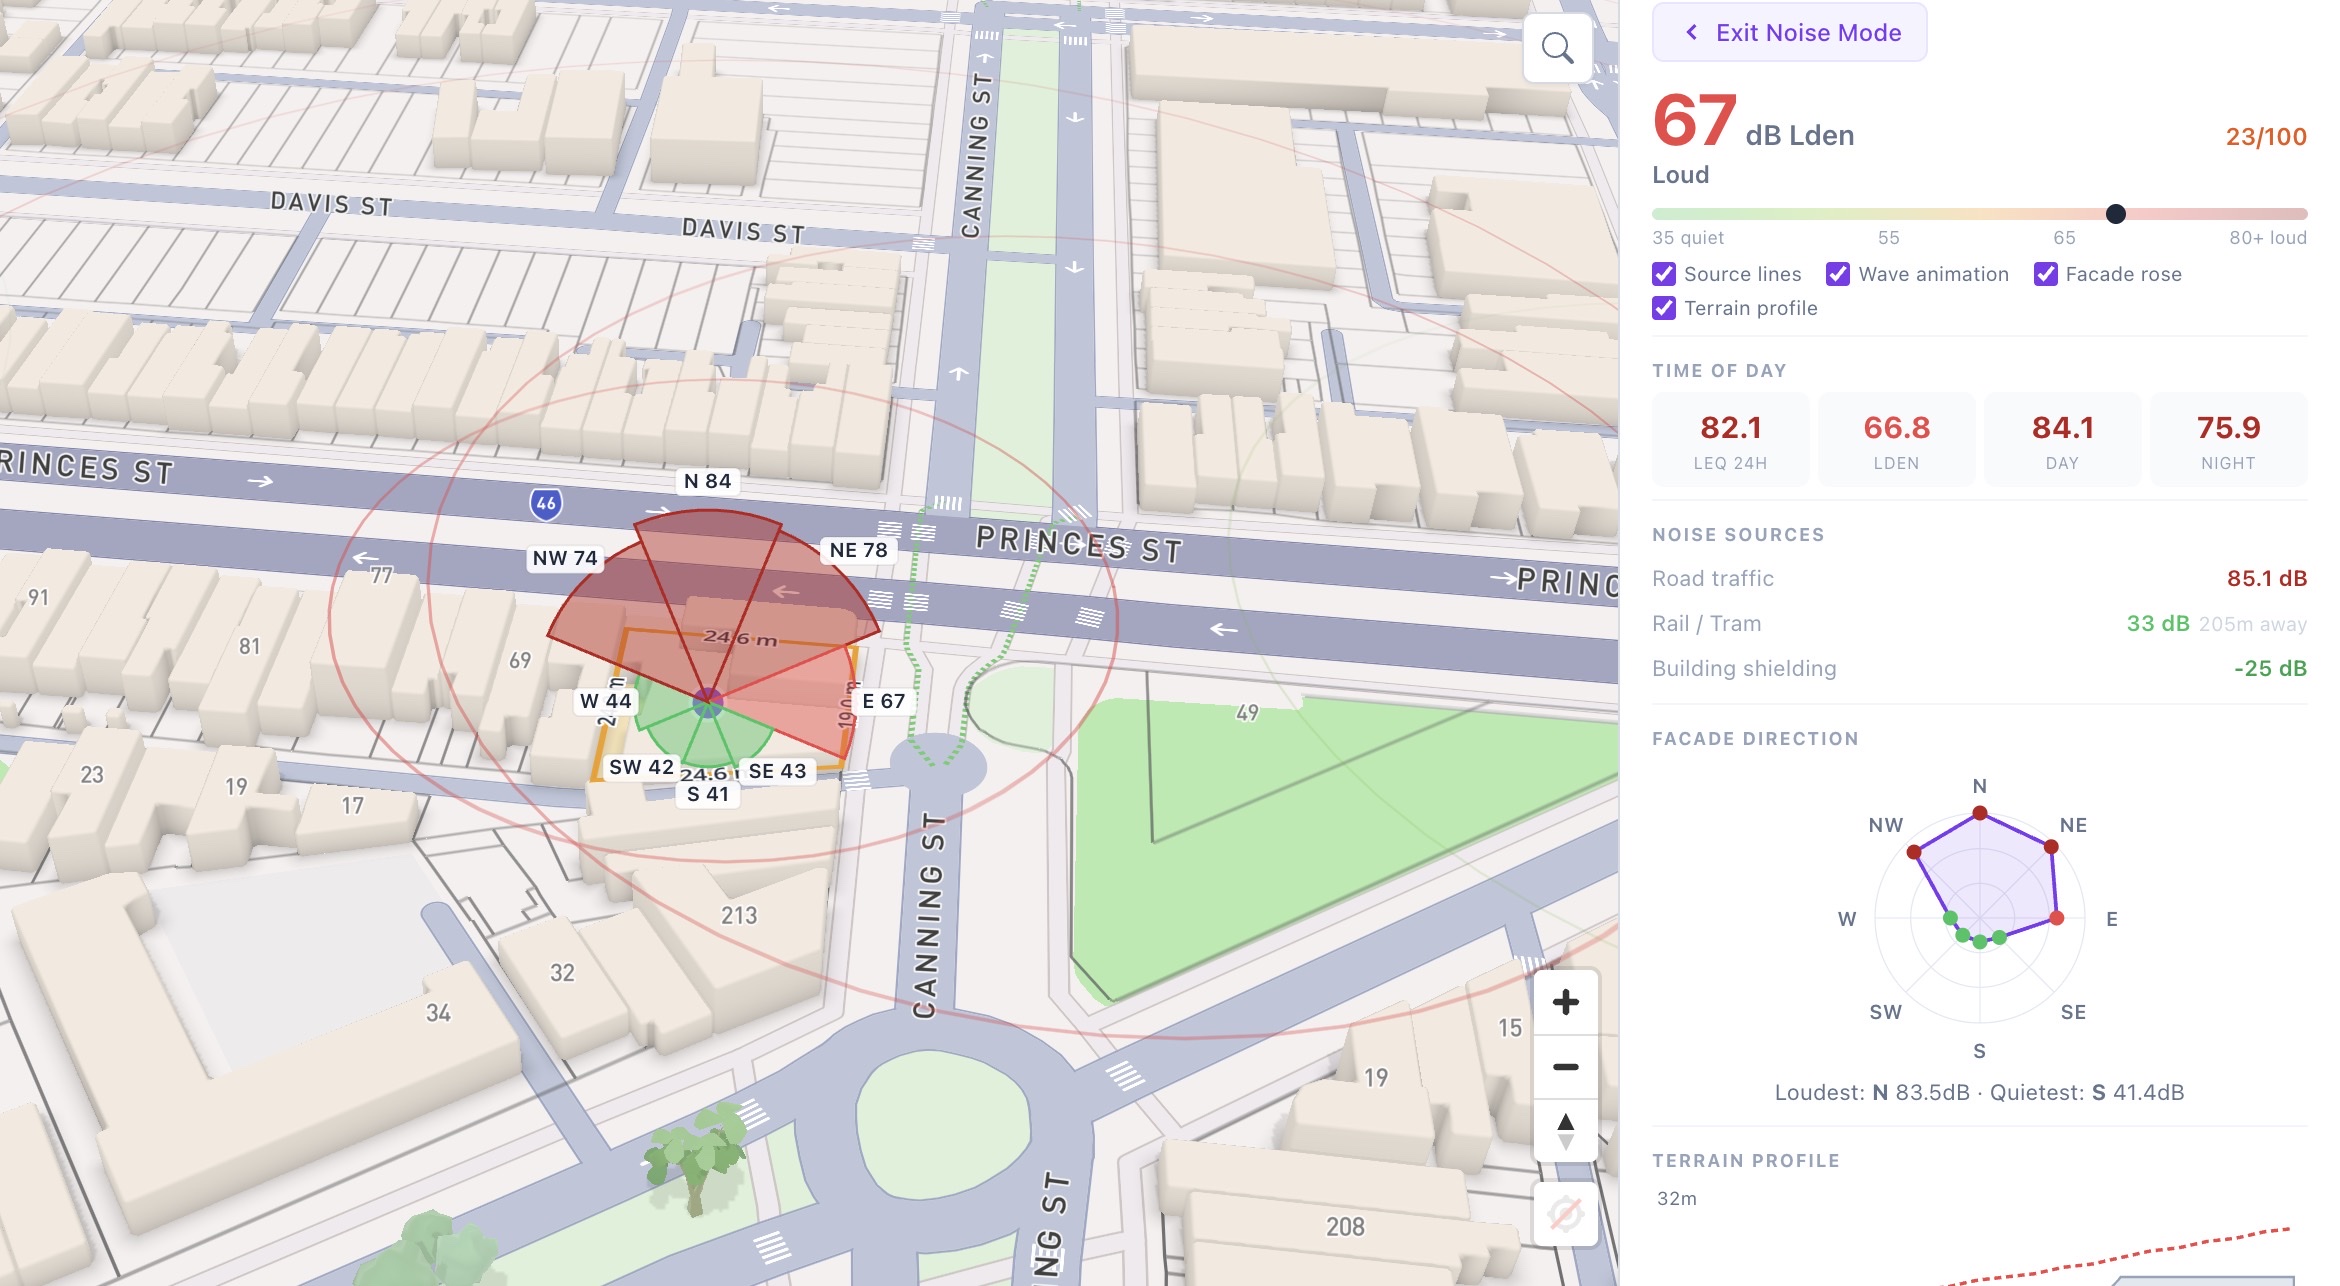
Noise, flood risk, bushfire, solar, heat island, walkability, contamination, and view quality. Instant assessment for any Australian address.
Explore Scores →Feasibility Calculator
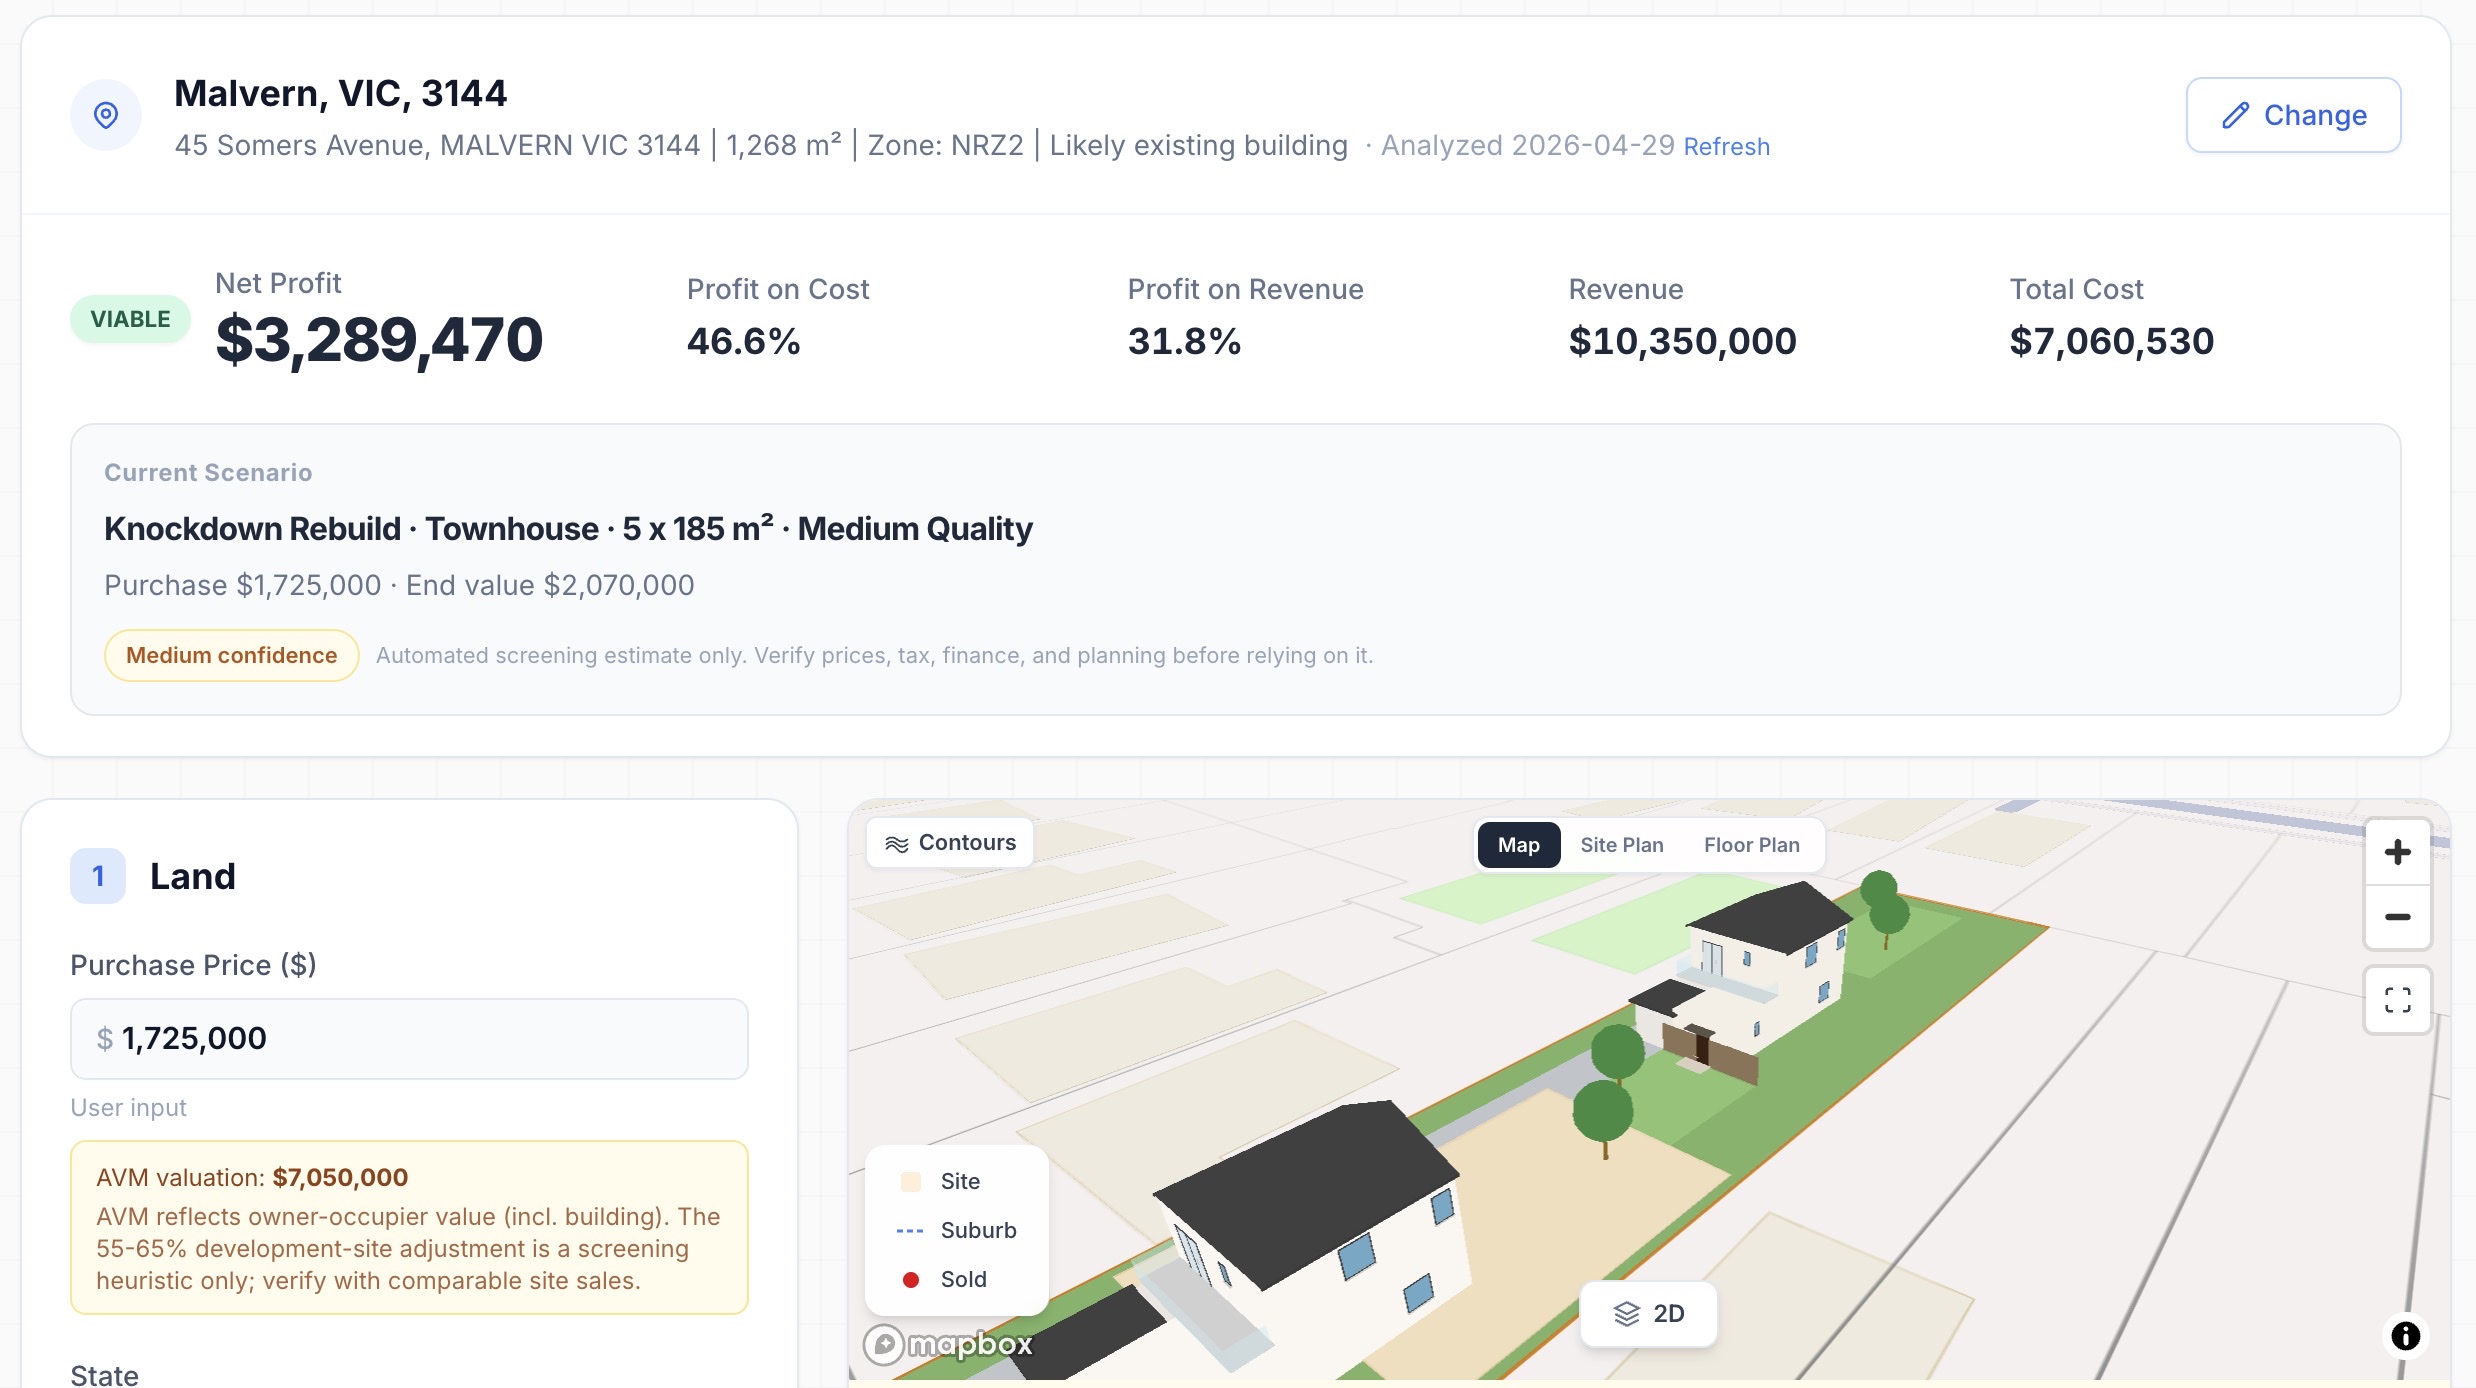
Model purchase price, construction costs, and end value. AI analysis reviews risks and market context. Compare townhouse, duplex, and apartment scenarios.
Run a Feasibility →Built for Property Professionals
Whether you're assessing a site, chasing leads, or researching a suburb.
Developers & Planners
Run feasibility studies with AI analysis. Check zoning, overlays, and property scores before you commit. Export PDF reports for stakeholders.
Trades & Builders
Get notified when new DAs match your trade and area. Featured listing puts you in front of property owners planning their project.
Researchers & Investors
Assess any address with 8 property scores. Flood results include official 1% AEP modelled depth where an integrated council study covers the point. See the evidence.
500K+ DA Leads Across Every Trade
AI-classified into 30+ categories. Filter by trade, council, state, or estimated value.
Browse Leads by Trade
Find development applications filtered by your specific trade category
Top Councils by DA Activity
Browse development applications from Australia's busiest councils
Latest from the Blog
Data-driven insights on Australian property development and building permits
NSW Council DA Approval Times, Ranked: From 7 Days to 54 (2025 Data)
We measured how long a development application actually takes to decide in every busy NSW council, using 110,667 real lodgement-to-decision records from 2025. The fastest councils turn a DA around in a week. The slowest take almost two months. Here is the full ranking, and what the gap is really telling you.
1,523 Childcare Centre DAs in 12 Months: Where Operators Are Building, and How Long Approval Really Takes
We tracked 1,523 childcare-related development applications lodged across Australian councils in 12 months. The state split, the busiest councils, the median 102-day NSW approval timeline, and what the DA record tells you before you buy a site.
CDC vs DA in NSW: What 518,000 Applications Say About the Fast Track
Five years of NSW planning data: complying development's share of new applications has climbed from 25% to 45%, and the median CDC is determined in 5 days against 57 for a DA.
SA's Three Approval Lanes: What 167,000 Applications Say About Deemed-to-Satisfy
South Australia splits development assessment into Accepted, Deemed-to-Satisfy and Performance Assessed lanes. Data on 167,000 applications since the 2021 Code: 3 in 10 take a codified lane, and the gap between councils runs from 52% to 12%.
Where NSW Builds Fast: CDC Share by Council, From 69% to 7%
A league table of 70 NSW councils by complying development share. Ryde tops out at 69%, Clarence Valley bottoms at 7%, and the gap is mostly written into the land itself.
8,092 Granny Flat DAs in 12 Months: Where Australia Is Actually Building Them
We tracked 8,092 granny flat and secondary dwelling applications lodged across Australian councils in the past 12 months. The state split, the top councils, how fast decisions actually come back, and what the numbers miss.
Start with the map. Go as deep as you need.
Free to explore. Pro at $49/month for property scores, AI analysis, full addresses, and PDF reports.