
Logan City Council: 1,753 development applications in the first three months of 2026. That is more than any council in NSW, including Sydney CBD (766). More than every council in Victoria. More than every council in South Australia.
A Queensland council is leading Australia's DA pipeline. And it is not Brisbane.
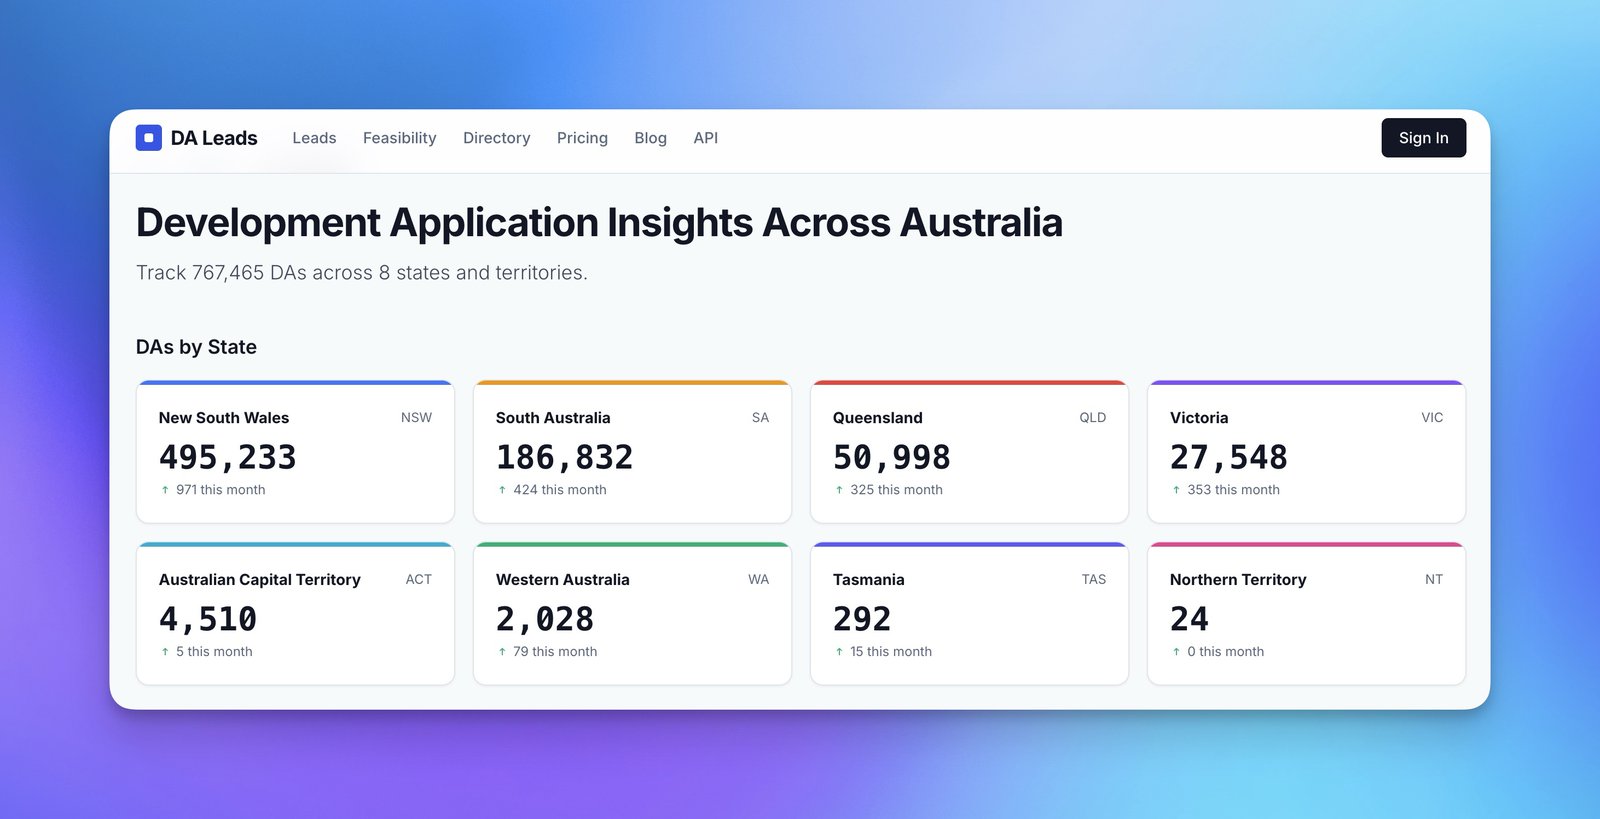
The DA Leads insights dashboard tracks 767,465 DAs across 8 states and territories. This article focuses on 2026 data only. Source: DA Leads insights dashboard.
National Top 25: The Busiest Councils in 2026
We pulled every 2026 DA from the DA Leads database on 8 April. No historical data mixed in. Just this year.
Top 25 councils ranked by 2026 DA count (Jan-Apr). Source: DA Leads database, queried 2026-04-08.
| Rank | Council | State | 2026 DAs |
|---|---|---|---|
| 1 | Logan City Council | QLD | 1,753 |
| 2 | Brisbane City Council | QLD | 1,541 |
| 3 | Central Coast Council | NSW | 898 |
| 4 | Blacktown City Council | NSW | 834 |
| 5 | Council of the City of Sydney | NSW | 766 |
| 6 | Onkaparinga Council | SA | 737 |
| 7 | Canterbury-Bankstown Council | NSW | 663 |
| 8 | Lake Macquarie City Council | NSW | 663 |
| 9 | Camden Council | NSW | 642 |
| 10 | Liverpool City Council | NSW | 626 |
| 11 | Northern Beaches Council | NSW | 579 |
| 12 | Port Adelaide Enfield Council | SA | 579 |
| 13 | Moreton Bay Regional Council | QLD | 565 |
| 14 | The Hills Shire Council | NSW | 559 |
| 15 | Campbelltown City Council | NSW | 555 |
| 16 | Wollondilly Shire Council | NSW | 544 |
| 17 | Shoalhaven City Council | NSW | 534 |
| 18 | Wollongong City Council | NSW | 534 |
| 19 | Penrith City Council | NSW | 525 |
| 20 | City of Parramatta Council | NSW | 508 |
| 21 | Charles Sturt Council | SA | 506 |
| 22 | Sutherland Shire Council | NSW | 505 |
| 23 | Inner West Council | NSW | 504 |
| 24 | Newcastle City Council | NSW | 492 |
| 25 | Cumberland Council | NSW | 485 |
Three things jump out. First, Queensland takes both the #1 and #2 spots nationally. Second, SA's Onkaparinga Council cracks the top 6, ahead of established NSW heavyweights like Canterbury-Bankstown and Liverpool. Third, the gap between Logan (1,753) and the #3 council (Central Coast at 898) is enormous.
Top Councils on the Map
The busiest councils span from Queensland's SEQ corridor down through Sydney's western arc and into Adelaide's northern suburbs.
Geographic distribution of the 10 busiest councils in 2026. Source: DA Leads database, queried 2026-04-08.
State Rankings
Each state has a different story. NSW has the broadest coverage (128 councils), so its rankings carry the most statistical weight. QLD only covers 24 councils but those 24 include the nation's busiest. SA has strong metro coverage. VIC's data skews toward established inner suburbs.
New South Wales: 23,078 DAs across 128 Councils
NSW remains the backbone of our dataset at 53.9% of all 2026 records. The top 10 NSW councils are spread across Greater Sydney, the Central Coast and the Illawarra.
| Rank | Council | 2026 DAs |
|---|---|---|
| 1 | Central Coast Council | 898 |
| 2 | Blacktown City Council | 834 |
| 3 | Council of the City of Sydney | 766 |
| 4 | Lake Macquarie City Council | 663 |
| 5 | Canterbury-Bankstown Council | 663 |
| 6 | Camden Council | 642 |
| 7 | Liverpool City Council | 626 |
| 8 | Northern Beaches Council | 579 |
| 9 | The Hills Shire Council | 559 |
| 10 | Campbelltown City Council | 555 |
Central Coast takes the NSW lead for 2026, pushing ahead of Blacktown which held the all-time crown in our historical data. The western Sydney corridor (Blacktown, Camden, Liverpool, Campbelltown, The Hills) still accounts for over 3,200 DAs combined. But the surprise is how strong the Central Coast and Hunter region (Lake Macquarie at #4) are tracking.
Queensland: 5,804 DAs across 24 Councils
QLD only covers 24 councils in our database, but two of them outrank every other council in Australia.
| Rank | Council | 2026 DAs |
|---|---|---|
| 1 | Logan City Council | 1,753 |
| 2 | Brisbane City Council | 1,541 |
| 3 | Moreton Bay Regional Council | 565 |
| 4 | Gold Coast City Council | 477 |
| 5 | Somerset Regional Council | 185 |
| 6 | Sunshine Coast Regional Council | 178 |
| 7 | Toowoomba Regional Council | 173 |
| 8 | Ipswich City Council | 173 |
| 9 | Townsville City Council | 106 |
| 10 | Maranoa Regional Council | 104 |
Logan is the standout story of 2026 so far. At 1,753 DAs it is 212 more than Brisbane, a council that covers a geographic area roughly 10 times larger. The SEQ corridor (Logan + Brisbane + Moreton Bay + Gold Coast + Ipswich) accounts for 4,509 of Queensland's 5,804 DAs: 78% of the state's tracked activity sitting in one growth belt.
Victoria: 4,647 DAs across 87 Councils
Victoria has broad council coverage (87 councils) but lower total volume. The top councils are all established metro areas where renovation and extension work dominates over greenfield development.
| Rank | Council | 2026 DAs |
|---|---|---|
| 1 | Melbourne City Council | 393 |
| 2 | Boroondara City Council | 316 |
| 3 | City of Casey | 283 |
| 4 | Monash City Council | 236 |
| 5 | City of Stonnington | 227 |
| 6 | City of Glen Eira | 201 |
| 7 | Mornington Peninsula Shire Council | 194 |
| 8 | City of Greater Geelong | 184 |
| 9 | Manningham City Council | 163 |
| 10 | Frankston City Council | 135 |
Melbourne City Council leads, but the inner-east cluster is the real theme: Boroondara (316), Stonnington (227), Glen Eira (201), and Monash (236) are all within 15km of the CBD. These are established suburbs where homeowners are upgrading, not building from scratch. Casey (283) is the exception, sitting in Melbourne's south-east growth corridor where new estates drive DA volume.
South Australia: 8,150 DAs across 71 Councils
SA is a quiet powerhouse in 2026. With 8,150 DAs across 71 councils, it has nearly double Victoria's volume despite a smaller population. Adelaide's northern suburbs lead the charge.
| Rank | Council | 2026 DAs |
|---|---|---|
| 1 | Onkaparinga Council | 737 |
| 2 | Port Adelaide Enfield Council | 579 |
| 3 | Charles Sturt Council | 506 |
| 4 | Salisbury Council | 476 |
| 5 | Playford Council | 418 |
| 6 | Tea Tree Gully Council | 372 |
| 7 | Marion Council | 363 |
| 8 | Mitcham Council | 272 |
| 9 | West Torrens Council | 266 |
| 10 | Alexandrina Council | 262 |
Onkaparinga (737) is Adelaide's largest council by area, stretching from the southern suburbs to McLaren Vale. Its DA volume puts it 6th nationally. The northern growth corridor of Salisbury (476) and Playford (418) combined nearly matches Onkaparinga alone. SA's data from the PlanSA portal has been consistently strong, giving us one of the most complete state-level pictures.
Western Australia, Tasmania and ACT
WA, TAS and ACT have limited coverage in 2026. We are expanding data sources for these states, so treat these as early indicators rather than complete rankings.
WA (785 DAs, 8 councils): City of Stirling leads at 281, followed by City of Swan (138) and City of South Perth (127). Coverage is expanding.
ACT (318 DAs, 1 council): All records sit under a single planning authority.
TAS (56 DAs, 2 councils): Coverage just beginning.
What Work Is Getting Approved? Trade Categories in 2026
Raw council rankings tell you where the work is. Trade categories tell you what the work is.
DA breakdown by trade category across all 42,838 tracked applications in 2026. Categories assigned by DA Leads AI classification. Source: DA Leads database, queried 2026-04-08.
Renovation and extension dominates at 8,338 DAs (19.5% of all 2026 records). But the real surprise is in position #2: Garage, carport and shed at 3,192, edging out both subdivision (3,134) and new dwelling (2,773).
Sheds beating new houses is a story about how Australians are actually using their properties. Post-COVID remote work keeps driving demand for home workshops, studios and storage. And a shed DA is typically faster to approve and cheaper to build than a new dwelling.
Swimming pools at 2,667 and granny flats at 1,786 round out the high-volume categories. Both represent single-contractor jobs where one DA often means one winner.
What This Means for Different Trades
Builders and renovators: Renovation DAs are everywhere, but the highest concentration is in established metro councils. In NSW, Central Coast and Blacktown lead. In VIC, Boroondara and Stonnington. Follow the older suburbs where homeowners are spending.
New home builders: New dwelling DAs cluster in growth corridors. Camden and Liverpool in western Sydney, Casey in Melbourne's south-east, Playford in Adelaide's north, Logan and Moreton Bay in SEQ. These are the greenfield frontlines.
Pool builders: Swimming pool DAs at 2,667 nationally follow household income and climate. Expect higher concentrations across Sydney's northern beaches, Brisbane, and Adelaide's southern suburbs.
Granny flat specialists: Granny flat DAs at 1,786 are a growing category, driven by housing affordability pressure and state-level policy changes encouraging secondary dwellings. Western Sydney remains the national hotspot.
Subdivision and land developers: Subdivision DAs at 3,134 are strong in SA (where Onkaparinga and Playford are active) and in NSW growth areas like Camden and Wollondilly.
Commercial contractors: Commercial and industrial DAs at 2,743 are more evenly distributed. Sydney CBD, Brisbane, and Adelaide's Port Adelaide Enfield all show consistent commercial activity.
How to Use This Data
Rankings give you a starting filter. Here is how to turn it into actual leads:
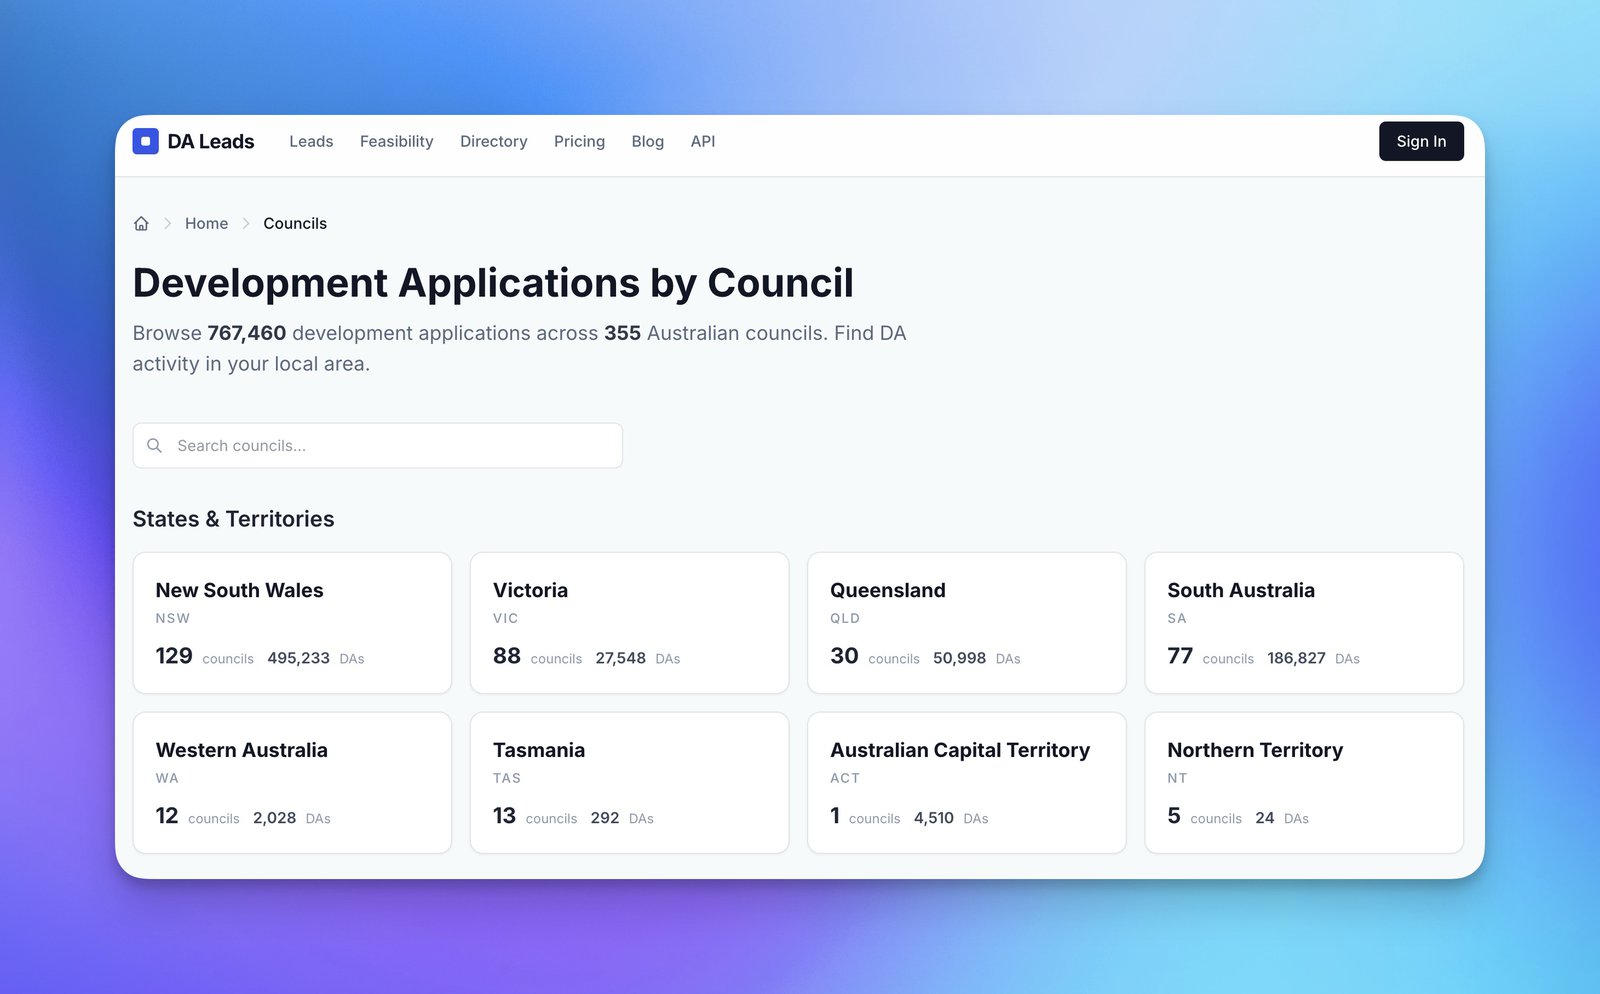
The DA Leads councils directory lets you search and filter 355 councils by state. Source: DA Leads councils directory.
-
Find your council. Start with the councils directory and filter by state. Which high-volume councils sit inside your service radius?
-
Check the trade mix. A council with 800 DAs might have zero in your category. Click through to the council page and check what types of work are being approved.
-
Look at the timing. DAs lodged last month are projects that need trades in 3-6 months. DAs approved last week might need you now. The insights dashboard shows recent activity trends.
-
Compare neighbouring councils. The busiest council in your area might be oversaturated with competitors. Sometimes the #3 council in your radius offers better win rates.
-
Set up alerts. DA Leads can notify you when new applications matching your trade and location hit the database.
Browse all councils | National insights hub | Browse by trade
Frequently Asked Questions
Which council has the most development applications in 2026? Based on our 2026 data, Logan City Council in Queensland leads with 1,753 DAs, followed by Brisbane City Council (1,541) and Central Coast Council in NSW (898).
Why do some states have more DAs than others in this data? Our coverage varies by state. NSW covers 128 councils, SA covers 71, VIC covers 87, but QLD only covers 24 and WA covers 8. State-level totals reflect both real DA activity and our data coverage depth. We are adding new data sources continuously.
What type of DA is most common in 2026? Renovation and extension projects lead at 8,338 DAs (19.5%), followed by garage/carport/shed (3,192) and subdivision (3,134).
How often is this data updated? DA Leads continuously scrapes planning portals and updates the database. The numbers in this article are from 8 April 2026, but the insights pages always show current totals.
Can I filter DAs by my specific trade? Yes. DA Leads categorises every application by trade type. Browse by category on the trades page to find applications matching your speciality.


