
If you're buying property in Melbourne, you've probably looked up school zones. But most people check one school at a time on MySchool, or glance at a "top schools" list that ranks individual schools rather than areas.
That approach misses the point. Your child doesn't attend one school for 13 years. They go through childcare, primary school, and secondary school, often in the same suburb. The real question isn't "which school is best?" It's "which suburb gives my family consistently strong options from age 3 to year 12?"
We analysed 2,310 Victorian schools (ACARA ICSEA scores), 5,027 childcare services (ACECQA NQS ratings), and school catchment boundaries from the Victorian Department of Education to answer that question.
How We Measured
Schools: ICSEA (Index of Community Socio-Educational Advantage) is a score calculated by ACARA for every Australian school. The national average is 1,000. Above 1,050 puts a school comfortably in the top 30%. Above 1,100 is strong. Above 1,150 is among the best in the state.
Childcare: The ACECQA National Quality Standard rates every childcare and early education service on a 1 to 4 scale. A score of 3 means "Meeting NQS" (the expected standard). A 4 means "Exceeding NQS" (above the standard). We averaged these scores by suburb.
What counts as "triple-strong": A suburb needed to have at least one primary school and one secondary school both averaging ICSEA 1,050 or above, plus at least three rated childcare services averaging 3.0 (Meeting) or better.
Melbourne's Top 30 Suburbs by School Quality
These suburbs have the highest average ICSEA scores across all schools:
| Rank | Suburb | Schools | Avg ICSEA | Top School | Top Score |
|---|---|---|---|---|---|
| 1 | Clifton Hill | 2 | 1,178 | Clifton Hill Primary School | 1,186 |
| 2 | Glen Iris | 6 | 1,175 | Camberwell South Primary School | 1,183 |
| 3 | Armadale | 3 | 1,173 | Lauriston Girls' School | 1,199 |
| 4 | Fairfield | 1 | 1,170 | Fairfield Primary School | 1,170 |
| 5 | Toorak | 4 | 1,169 | St Kevin's College | 1,192 |
| 6 | Fitzroy North | 5 | 1,166 | Fitzroy Community School | 1,221 |
| 7 | Burwood | 3 | 1,163 | Presbyterian Ladies' College | 1,207 |
| 8 | Ivanhoe | 5 | 1,161 | Ivanhoe Girls' Grammar School | 1,181 |
| 9 | Kew | 11 | 1,160 | Ruyton Girls' School | 1,198 |
| 10 | Canterbury | 6 | 1,160 | Canterbury Primary School | 1,192 |
| 11 | Surrey Hills | 4 | 1,159 | Our Holy Redeemer School | 1,180 |
| 12 | Alphington | 3 | 1,155 | Alphington Primary School | 1,173 |
| 13 | Hawthorn | 8 | 1,152 | Scotch College | 1,188 |
| 14 | South Yarra | 6 | 1,152 | Christ Church Grammar School | 1,213 |
| 15 | Brunswick East | 3 | 1,152 | Brunswick South Primary School | 1,171 |
| 16 | Ashburton | 3 | 1,152 | Solway Primary School | 1,161 |
| 17 | Murrumbeena | 2 | 1,151 | Murrumbeena Primary School | 1,161 |
| 18 | Malvern | 3 | 1,150 | Malvern Central School | 1,163 |
| 19 | Camberwell | 5 | 1,149 | Camberwell Primary School | 1,194 |
| 20 | Hawthorn East | 4 | 1,149 | Auburn South Primary School | 1,165 |
No surprises in the top 20: inner east Melbourne dominates. But a single high ICSEA average doesn't tell you much about the full childcare-to-year-12 experience.
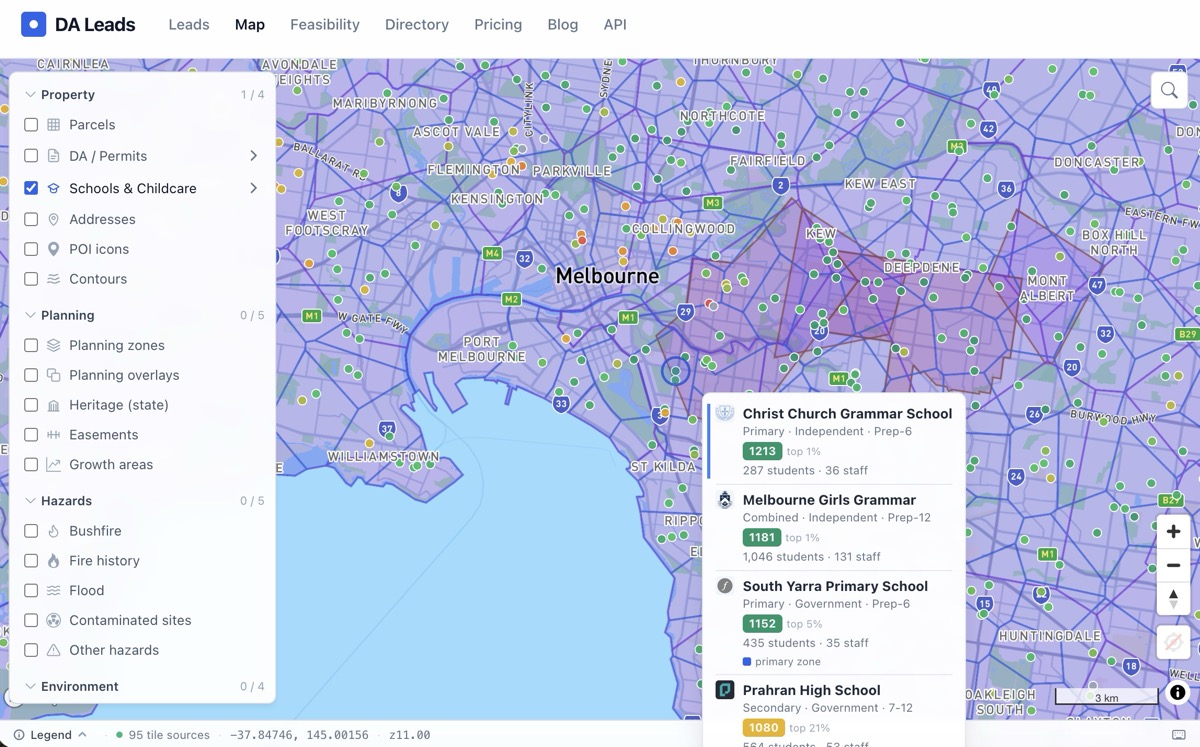
The Schools & Childcare layer on the DA Leads map, showing South Yarra schools colour-coded by ICSEA percentile. Christ Church Grammar (1,213, top 1%), Melbourne Girls Grammar (1,181), South Yarra Primary (1,152), and Prahran High (1,080) — with catchment boundaries visible.
The Triple-Strong Suburbs: Where Every Stage Is Good
This is the more useful list. These 20 suburbs scored well across all three stages: childcare, primary, and secondary.
| Suburb | Primary ICSEA | Secondary ICSEA | Childcare Avg | Childcare Exceeding |
|---|---|---|---|---|
| South Yarra | 1,182 | 1,137 | 3.6 | 4 of 7 |
| Hawthorn East | 1,164 | 1,135 | 3.5 | 4 of 8 |
| Canterbury | 1,192 | 1,130 | 3.2 | 3 of 10 |
| Beaumaris | 1,140 | 1,113 | 3.8 | 7 of 9 |
| Vermont | 1,150 | 1,122 | 3.5 | 5 of 8 |
| Brighton | 1,150 | 1,132 | 3.4 | 7 of 18 |
| Albert Park | 1,130 | 1,127 | 3.6 | 3 of 5 |
| Northcote | 1,160 | 1,132 | 3.2 | 4 of 12 |
| Brighton East | 1,150 | 1,106 | 3.5 | 6 of 12 |
| Port Melbourne | 1,134 | 1,101 | 3.7 | 5 of 7 |
| Fitzroy North | 1,186 | 1,086 | 3.3 | 4 of 9 |
| Hawthorn | 1,167 | 1,093 | 3.4 | 5 of 13 |
| Williamstown | 1,125 | 1,112 | 3.6 | 6 of 10 |
| Heidelberg | 1,135 | 1,111 | 3.5 | 3 of 6 |
| Elwood | 1,142 | 1,096 | 3.5 | 4 of 8 |
| Glen Waverley | 1,138 | 1,112 | 3.3 | 10 of 29 |
| Eltham | 1,118 | 1,110 | 3.5 | 7 of 15 |
| Balwyn North | 1,137 | 1,141 | 3.2 | 3 of 12 |
| Doncaster East | 1,133 | 1,124 | 3.2 | 5 of 23 |
| Mount Waverley | 1,145 | 1,120 | 3.1 | 4 of 22 |
We found 60 suburbs in total that meet the triple-strong threshold. The full list runs from South Yarra down to Belmont in regional Victoria.
What Stands Out
Beaumaris has the best childcare in Melbourne. Seven out of nine rated childcare services in Beaumaris are rated "Exceeding NQS." That's a concentration of top-rated early education that's hard to find anywhere else in the state. Combined with solid primary (1,140) and secondary (1,113) scores, Beaumaris is one of the most complete suburbs for families.
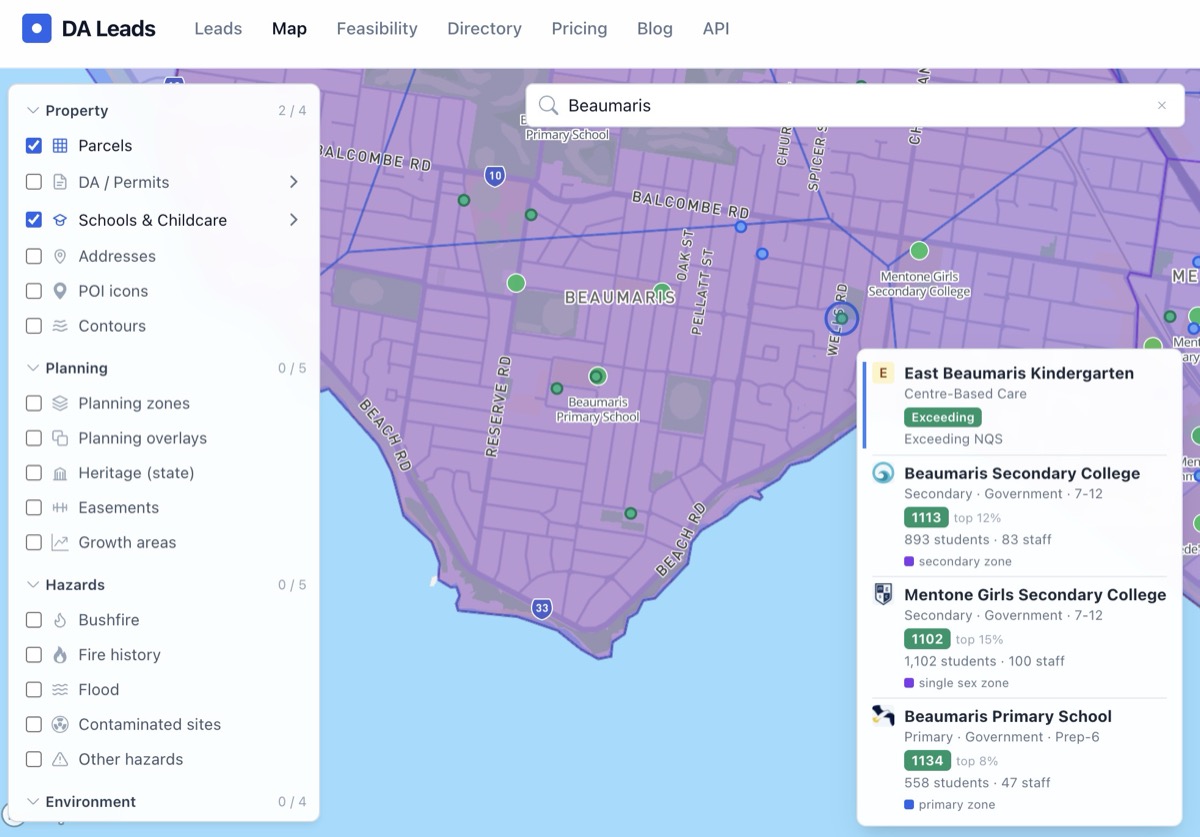
Beaumaris on the DA Leads map: East Beaumaris Kindergarten (Exceeding NQS), Beaumaris Secondary College (1,113, top 12%), Mentone Girls Secondary (1,102, top 15%), and Beaumaris Primary (1,134, top 8%) — all within walking distance, with primary and secondary catchment zones overlaid.
The inner east is strong but not always triple-strong. Suburbs like Toorak, Kew, and Glen Iris top the overall ICSEA rankings, but some lack a local secondary school that meets the 1,050 threshold, or don't have enough rated childcare services. A high ICSEA average doesn't automatically mean every stage is covered.
Some outer suburbs punch above their weight. Vermont (1,150 primary, 1,122 secondary, 3.5 childcare) and Eltham (1,118 / 1,110 / 3.5) are well outside the traditional eastern suburbs premium belt but deliver consistently strong education at every level, and at a significantly lower property price point.
Glen Waverley is the volume champion. With 8 primary schools, 3 secondary schools, and 29 childcare services, Glen Waverley offers families the widest choice in Melbourne. Ten of those childcare services are rated Exceeding. The breadth is unusual.
Where Schools Are Weakest
For context, here are suburbs at the other end of the scale (two or more schools, average ICSEA below 950):
| Suburb | Schools | Avg ICSEA |
|---|---|---|
| Robinvale | 2 | 890 |
| Heywood | 2 | 898 |
| Moe | 5 | 900 |
| Mooroopna | 4 | 918 |
| Frankston North | 3 | 918 |
| Roxburgh Park | 5 | 938 |
| Hampton Park | 6 | 944 |
These tend to be either rural or outer-growth-area suburbs where education investment has not kept pace with population growth. For developers building in growth areas, school quality is worth monitoring as a leading indicator of where the next amenity investment is likely to go.
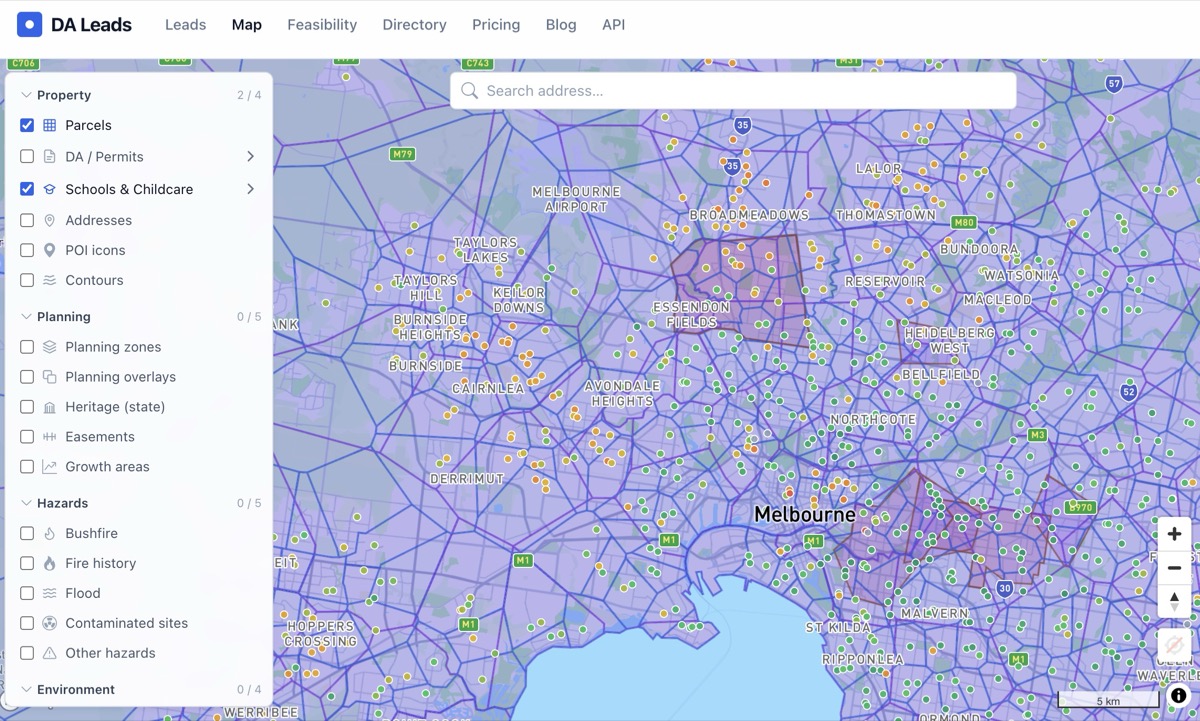
Melbourne's north and west on the DA Leads map: the colour shift from green (high ICSEA) in the inner east to orange and yellow in the growth corridors around Essendon Fields, Cairnlea, and Hoppers Crossing is visible at a glance. Each dot is a school you can click for ICSEA score, student count, and catchment zone.
Explore School Data on the Map
All the school and childcare data behind this analysis is available on the DA Leads interactive map. The Schools & Childcare layer shows:
- Every school colour-coded by ICSEA score (red → orange → yellow → green)
- Every childcare service colour-coded by NQS rating
- School catchment zone boundaries for Victoria
- Parcel boundaries, zoning overlays, and DA activity overlaid
Search any Melbourne address to see what schools and childcare services are nearby, check their ratings, and see which catchment zones cover the property.
Open the interactive map with Schools & Childcare layer →
Methodology
School data: ACARA School Profile 2025, covering 2,310 Victorian schools. ICSEA scores are calculated by ACARA based on parental occupation, parental education, remoteness, and proportion of Indigenous students. We excluded special schools from suburb averages.
Childcare data: ACECQA National Register, covering 5,027 Victorian services. NQS ratings are assessed against seven quality areas. We used the overall rating converted to a 1-4 numeric scale (Significant Improvement = 1, Working Towards = 2, Meeting = 3, Exceeding = 4).
Suburb aggregation: We averaged all school ICSEA scores within each suburb, separately for primary and secondary. For childcare, we averaged the numeric NQS rating. "Triple-strong" required primary average ICSEA ≥ 1,050, secondary average ICSEA ≥ 1,050, and childcare average rating ≥ 3.0, with a minimum of three rated childcare services.
Limitations: ICSEA measures community socio-educational advantage, not teaching quality directly. NQS ratings cover operational quality and learning environment, not child outcomes. Suburb boundaries don't always align with school catchment boundaries. Some families cross suburb lines for school.


