
In Flemington, two government primary schools sit 1.1 kilometres apart. Flemington Primary scores 1,140 on ICSEA. Debney Meadows Primary scores 903. The gap is 237 points.
To put that in context: the national average is 1,000. A 237-point gap is the difference between a school in Toorak and a school in Moe. Except these two schools aren't in different regions. They're in the same suburb. Their catchment zones share a boundary. A family on one side of that boundary walks their child to a school with an ICSEA in the top 10% nationally. A family 500 metres away walks their child to a school in the bottom 25%.
We analysed all 738 primary school catchment boundary pairs in Victoria to find where these cliffs exist, how common they are, and what they actually mean for property decisions.
How Catchment Boundaries Create ICSEA Cliffs
Victorian government schools have designated neighbourhood catchment zones. If you live inside the zone, your child has guaranteed enrolment. These zones tile across the state like a puzzle — every residential address falls within exactly one primary school's catchment.
The boundaries are drawn by the Department of Education based on geography, road networks, and school capacity. They're not drawn to balance socio-economic composition. A boundary might follow a railway line, a main road, or a creek. Whatever geographic feature happens to be convenient.
The result is that socio-economic composition in Melbourne doesn't always follow neat geographic lines. Public housing estates sit next to gentrified streets. Railway lines that once divided working-class neighbourhoods now run between different housing markets. When a catchment boundary happens to align with one of these transitions, the ICSEA scores on either side can diverge significantly.
This is worth understanding because ICSEA reflects the socio-economic profile of each school's catchment population, not the school's teaching or resourcing. As ACARA states: "An ICSEA value is not a rating of the school institution — of its staff performance, quality of teaching programs or nature of facilities." (ACARA Fact Sheet) Two adjacent schools can be equally well-run and produce comparable educational outcomes relative to their cohort, while showing a large ICSEA gap because they draw from communities with different demographic profiles.
The Data: 738 Boundary Pairs, Measured
We used the Victorian school catchment zone polygons to identify every pair of adjacent primary school zones. For each pair, we calculated the ICSEA gap and the distance between school locations. Here's the distribution:
| ICSEA Gap Range | Boundary Pairs | % of All Boundaries |
|---|---|---|
| 0-20 points | 288 | 39% |
| 21-50 points | 244 | 33% |
| 51-100 points | 154 | 21% |
| 101-150 points | 34 | 5% |
| 151-200 points | 14 | 2% |
| 200+ points | 4 | 1% |
The average gap between adjacent primary school zones is 40 ICSEA points. The median is 28. Most boundaries are modest.
But 7% of all boundaries — 52 pairs — have gaps exceeding 100 points. These aren't random variation. These are structural fault lines where catchment boundaries slice through Melbourne's socio-economic geography.
The 15 Streets Where ICSEA Drops Most Sharply
These are the catchment boundaries with the largest ICSEA gaps, all within 3 kilometres of each other:
| School A | ICSEA | School B | ICSEA | Gap | Distance |
|---|---|---|---|---|---|
| Debney Meadows Primary | 903 | Flemington Primary | 1,140 | 237 | 1.1 km |
| Brighton Primary | 910 | Brighton Beach Primary | 1,146 | 236 | 1.3 km |
| Sassafras Primary | 876 | Ferny Creek Primary | 1,111 | 235 | 2.7 km |
| Glenroy SC | 897 | Oak Park Primary | 1,095 | 198 | 0.7 km |
| Carlton Primary | 957 | Carlton North Primary | 1,148 | 191 | 0.8 km |
| Reservoir East Primary | 935 | Preston Primary | 1,113 | 178 | 1.5 km |
| Pleasant St Primary (Ballarat) | 1,095 | Wendouree Primary | 917 | 178 | 1.6 km |
| Fitzroy Primary | 1,028 | Clifton Hill Primary | 1,186 | 158 | 1.1 km |
| Kallista Primary | 1,118 | Olinda Primary | 964 | 154 | 2.9 km |
| Westbreen Primary | 1,051 | Glenroy SC | 897 | 154 | 1.5 km |
| Croydon Hills Primary | 1,095 | Croydon Primary | 955 | 140 | 1.7 km |
The top three gaps are all above 230 points, between schools whose catchment zones share a boundary. For families comparing homes on either side of these lines, it's useful to know that the ICSEA gap reflects the socio-economic composition of each catchment area rather than a difference in the schools' educational programs.
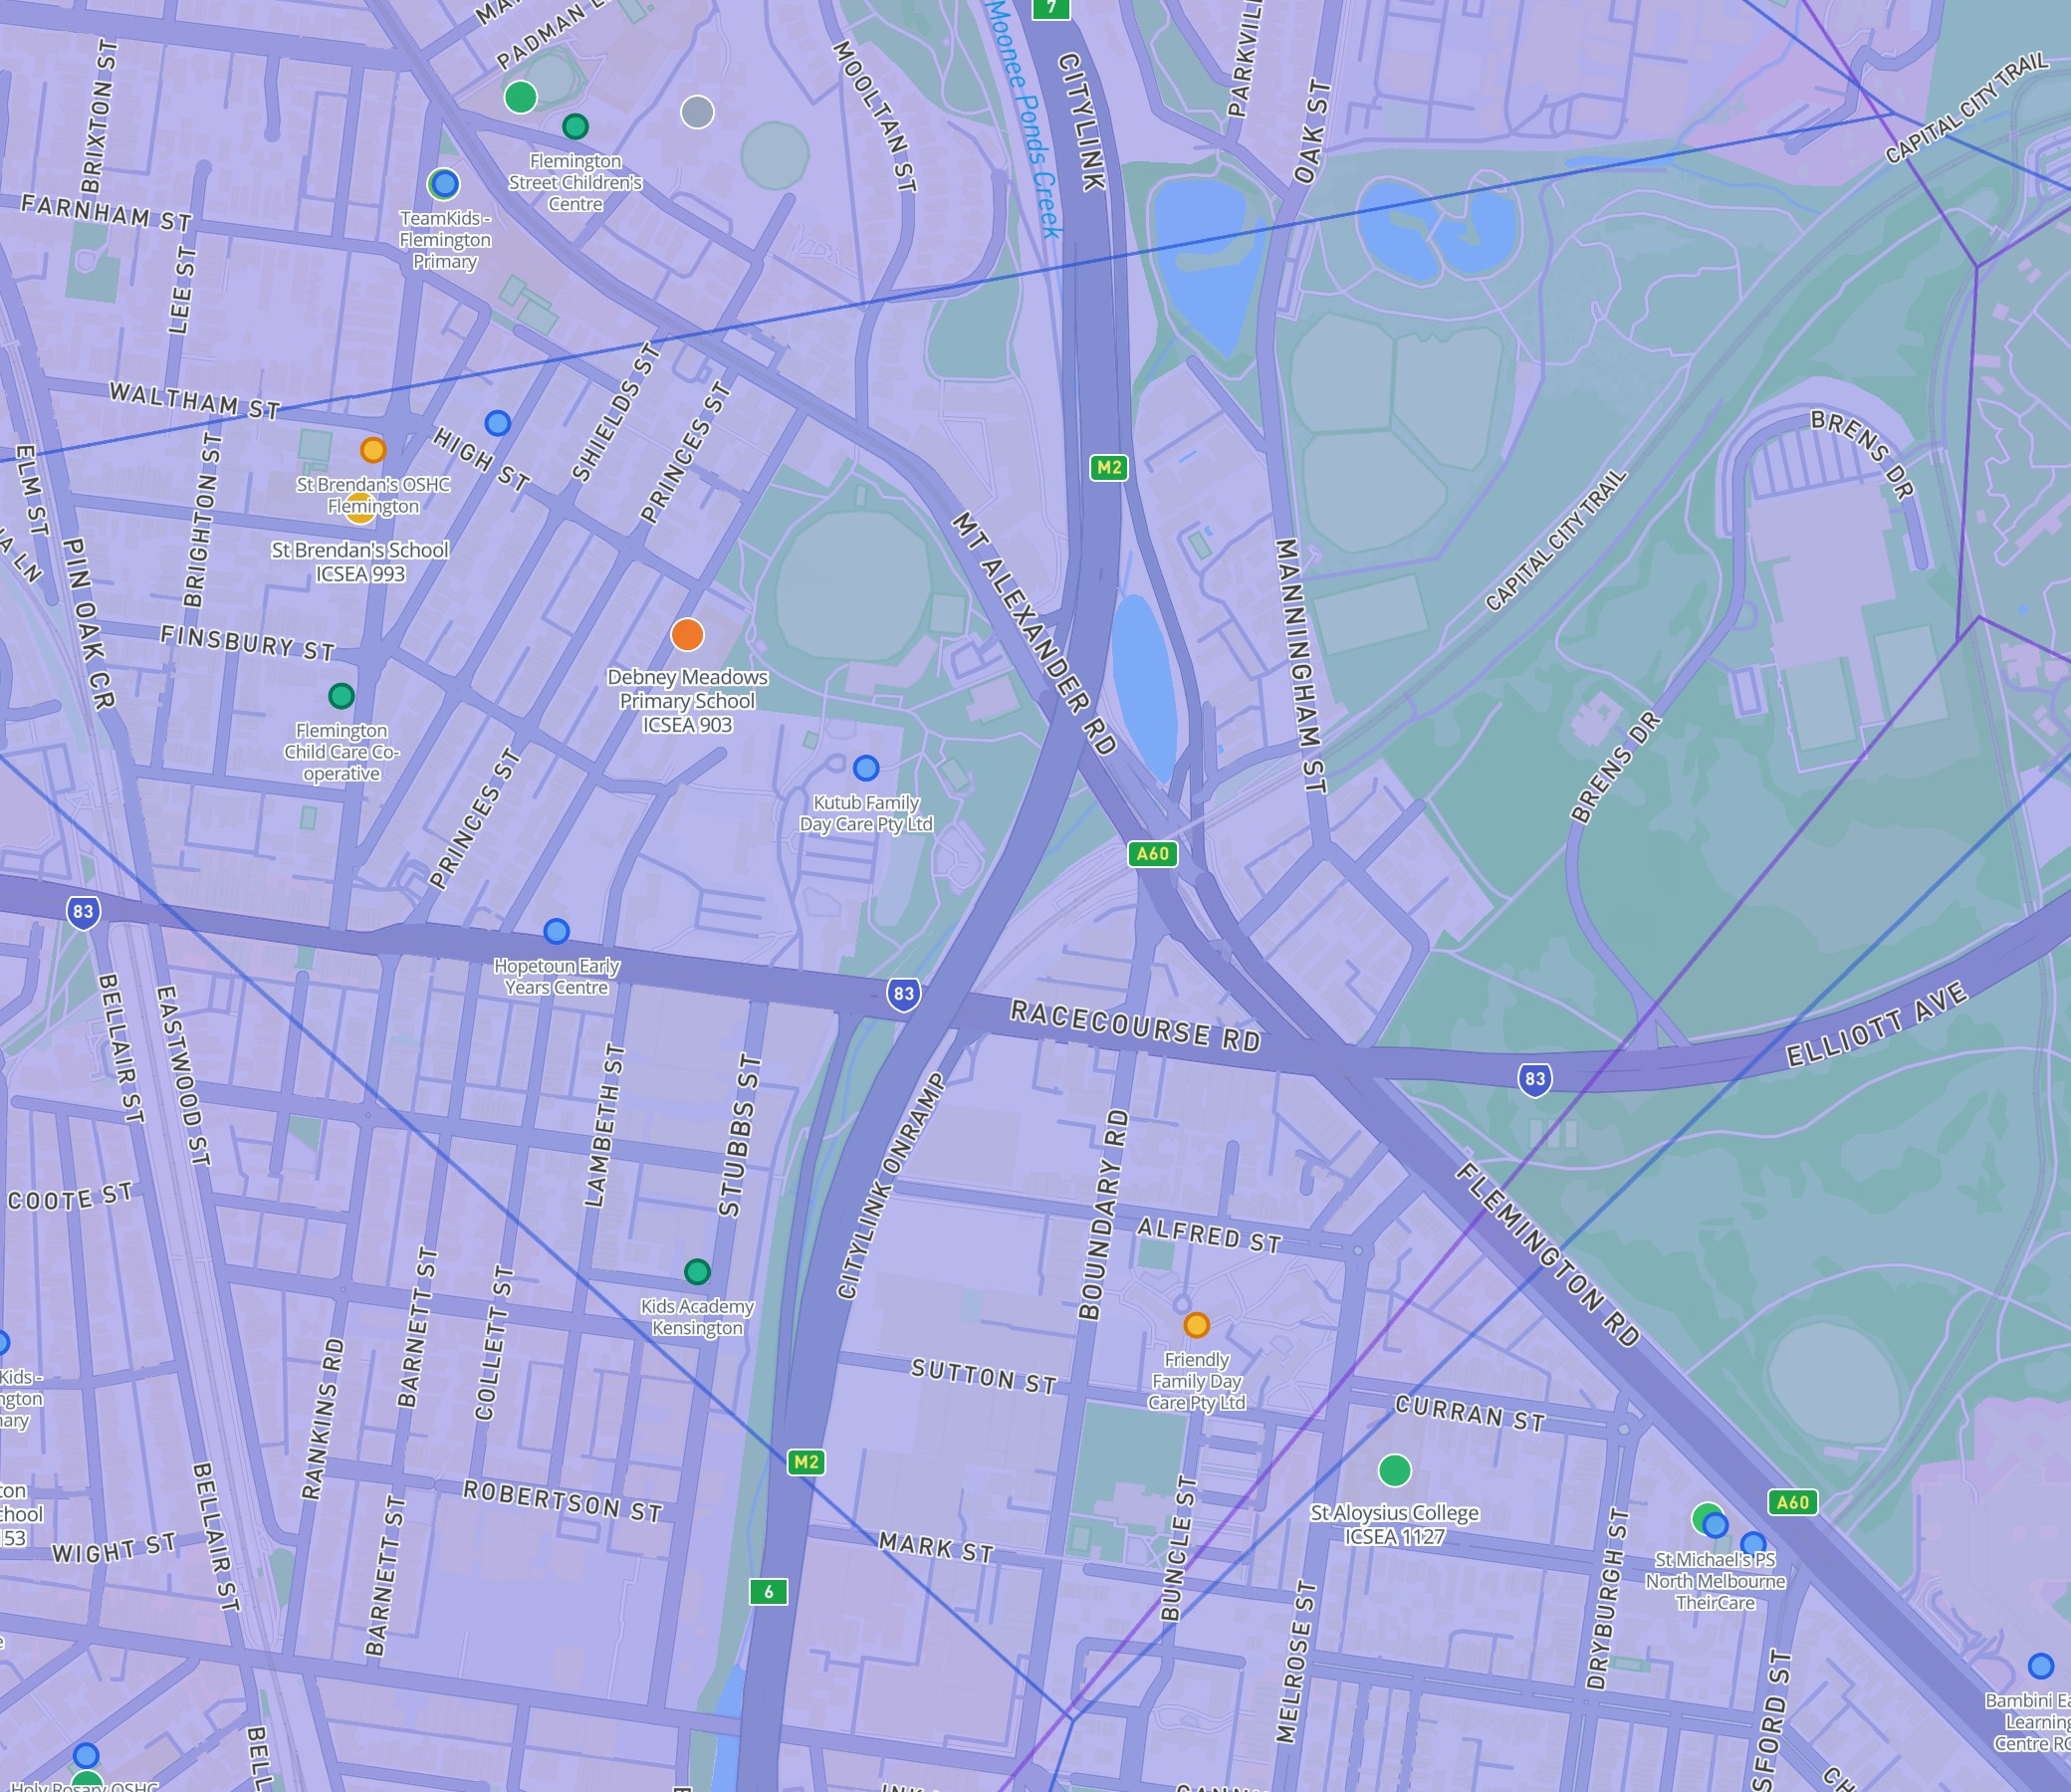
Case Study: Flemington's 237-Point Cliff
The Debney Meadows–Flemington boundary is the most extreme in Victoria. Here's why it exists.
Debney Meadows Primary School (ICSEA 903) draws from the Debney Meadows public housing estate — one of the largest in Melbourne's inner north. The estate was built in the 1960s and houses predominantly low-income families, many from refugee and migrant backgrounds.
Flemington Primary School (ICSEA 1,140) draws from the surrounding streets of renovated Victorian and Edwardian homes. These streets have gentrified significantly over the past two decades. Median house prices in the Flemington Primary catchment exceed $1.2 million.
The catchment boundary runs along a street that separates the estate from the surrounding residential streets. On one side: public housing, high-rise towers, low parental income and education (the ICSEA inputs). On the other: owner-occupied homes, professional families, high parental education.
Both schools operate within the same DET region, access the same professional development, and are assessed under the same framework. The 237-point gap reflects the demographic difference between the two catchment populations rather than a difference in educational provision.
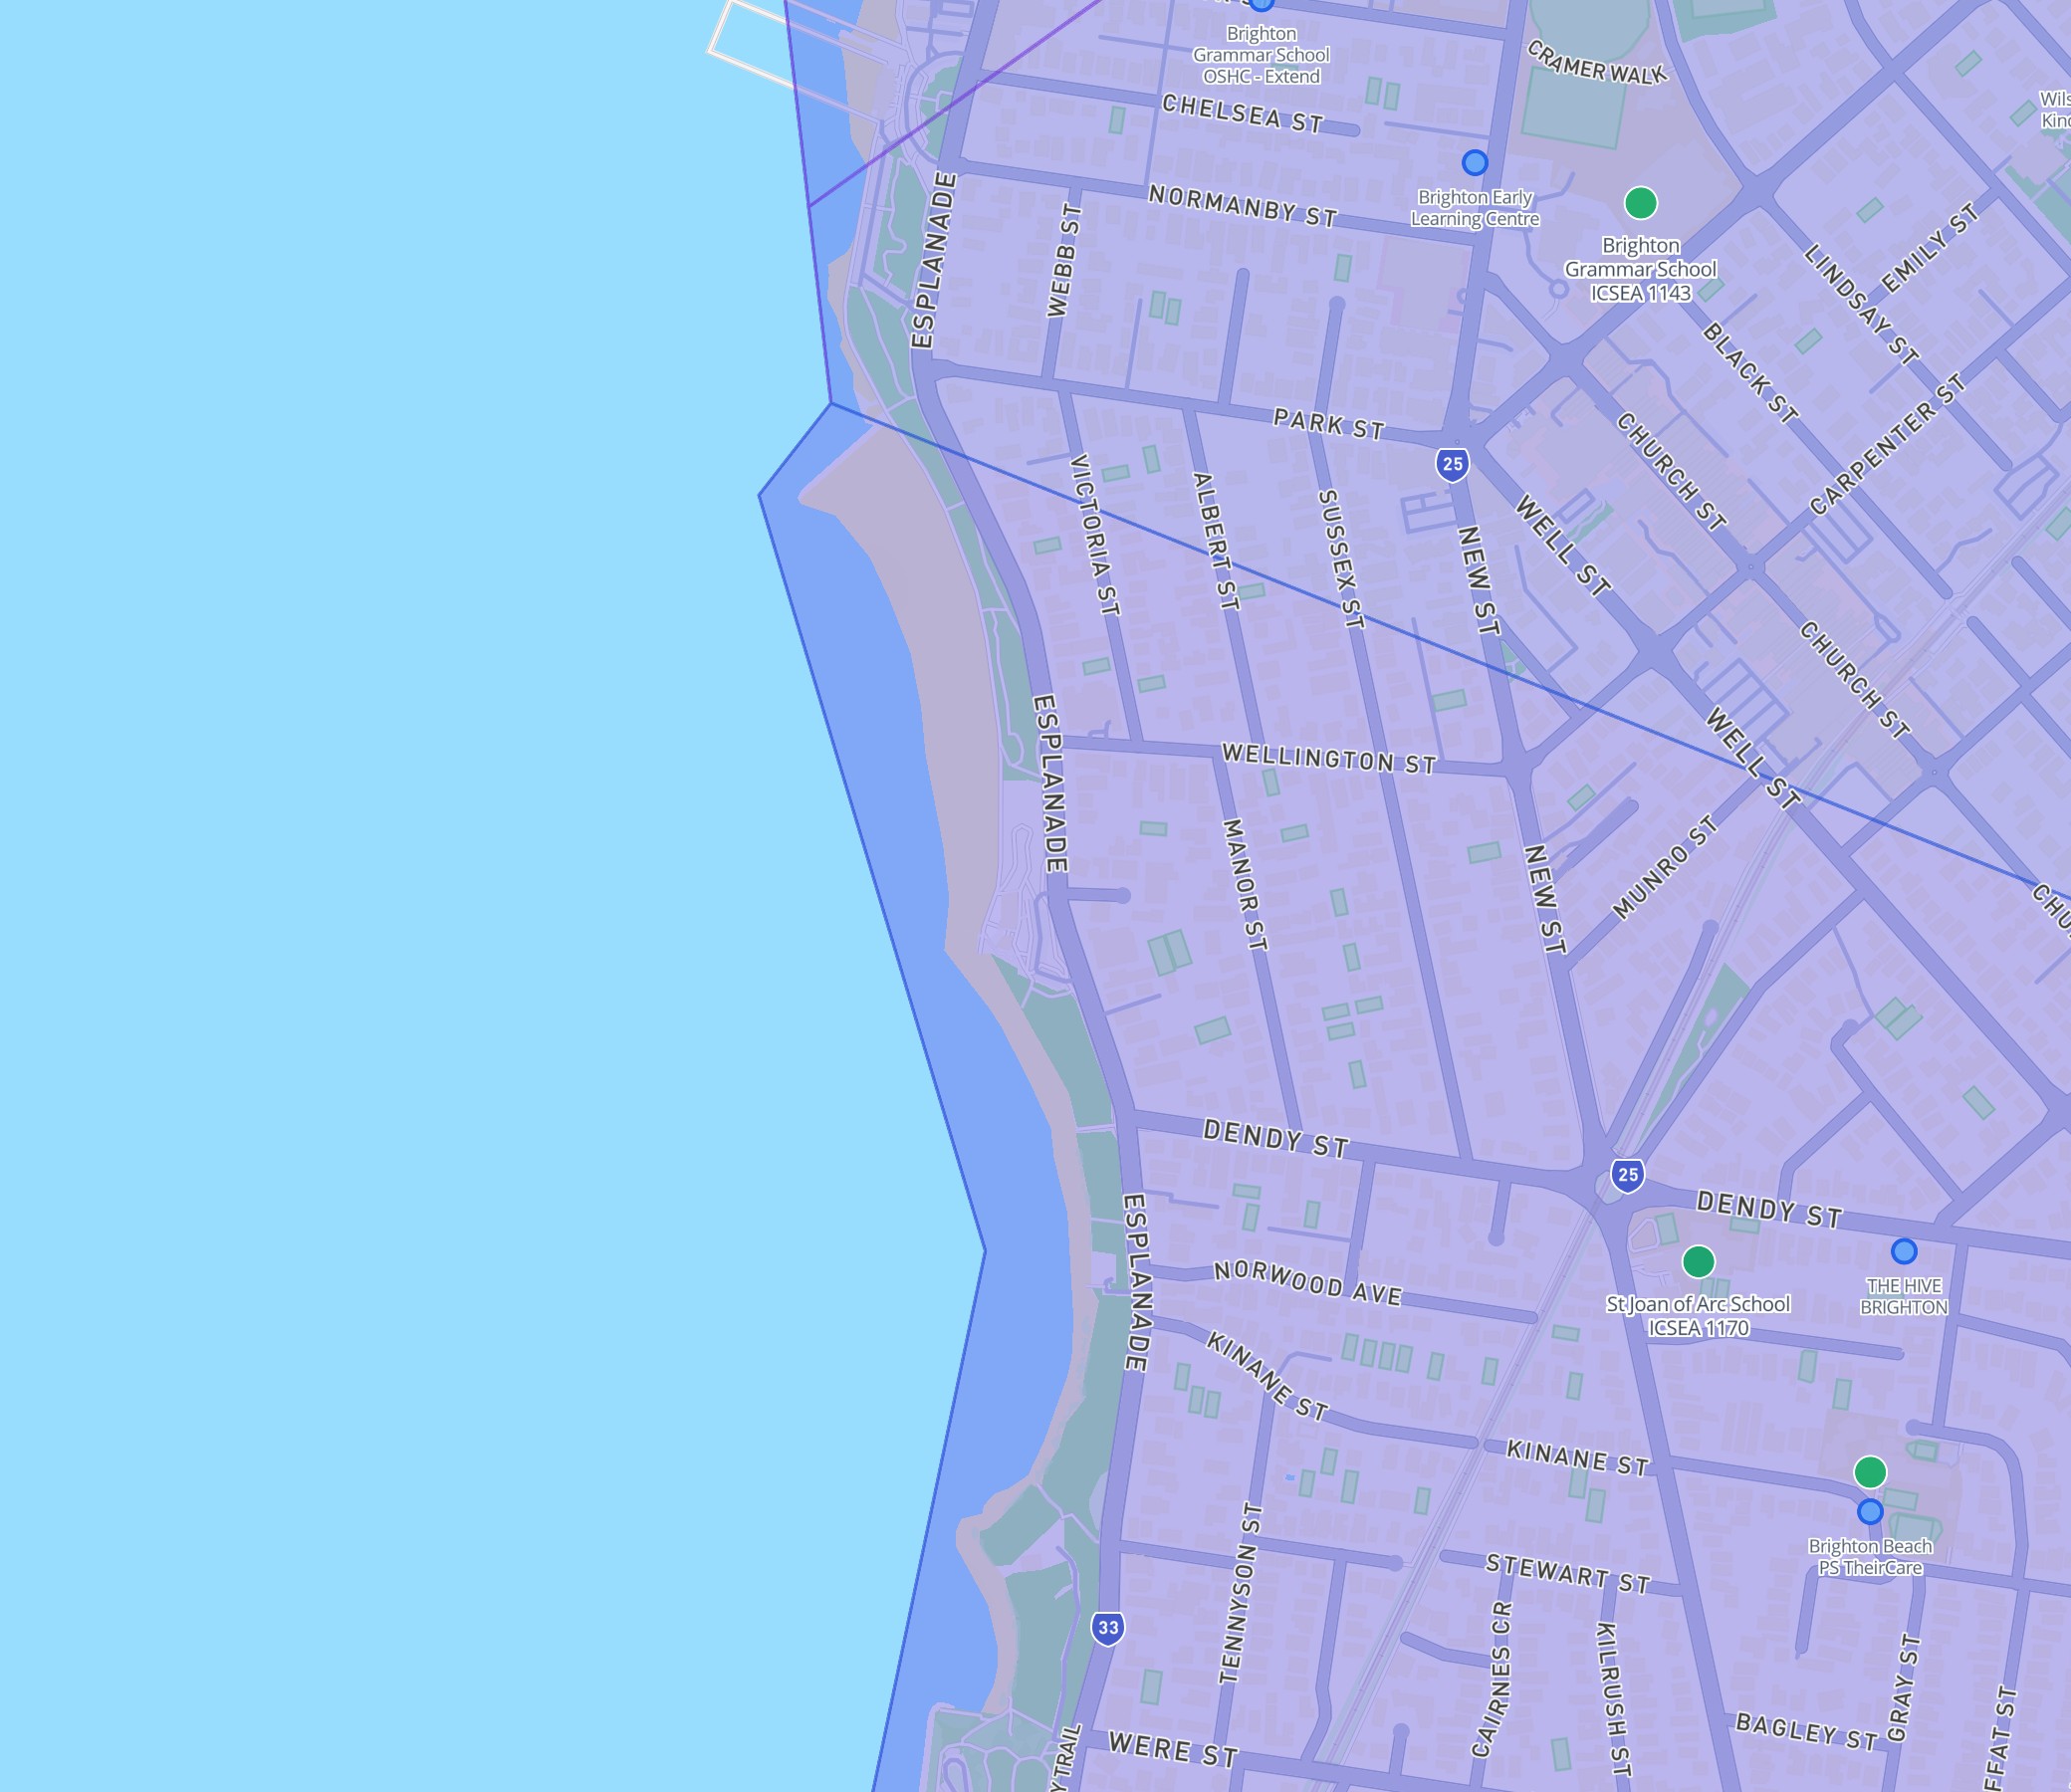
Case Study: Brighton's Same-Suburb Split
Brighton Beach Primary (ICSEA 1,146) and Brighton Primary (ICSEA 910) are 1.3 kilometres apart in one of Melbourne's wealthiest suburbs. The 236-point gap seems impossible. How can two schools in Brighton differ by this much?
Brighton Primary School serves a pocket that includes the Brighton public housing estate on Rippon Street and surrounding streets with a higher proportion of renters and lower-income families. Its catchment includes areas that most people wouldn't associate with "Brighton" — the affordable, less-manicured pockets behind the shopping strip.
Brighton Beach Primary draws from the streets closer to the beach — the postcard version of Brighton. Federation homes, established families, high professional representation.
This illustrates that suburbs are not monoliths. Brighton covers a range of housing types and income levels, and the catchment boundary happens to fall along the transition between them. The ICSEA scores reflect this demographic split within the suburb.
Why Secondary School Gaps Are Smaller
Secondary school catchments are much larger than primary catchments (235 zones vs 1,158). Larger catchments average out socio-economic extremes. A secondary zone that covers six primary zones will tend toward the mean.
The largest secondary gap: Richmond High School (987) and Melbourne Girls College (1,142) — 155 points, 1.2 kilometres apart. That's still significant, but smaller than the primary extremes.
| School A | ICSEA | School B | ICSEA | Gap | Distance |
|---|---|---|---|---|---|
| Richmond High | 987 | Melbourne Girls College | 1,142 | 155 | 1.2 km |
| Vermont SC | 1,122 | Heathmont College | 1,014 | 108 | 2.7 km |
| Strathmore SC | 1,086 | Pascoe Vale Girls SC | 987 | 99 | 1.3 km |
| Rowville SC | 1,028 | Lyndale SC | 935 | 93 | 3.1 km |
| Prahran High | 1,080 | Richmond High | 987 | 93 | 1.7 km |
The average secondary gap is 38 points, close to the primary average of 40. But the extremes are compressed: the maximum secondary gap is 155 vs 237 for primary. Larger catchments do what they're supposed to do — smooth variation.
This has a practical implication for property buyers. At the primary level, which side of the boundary you're on can matter enormously for ICSEA. At the secondary level, the effect is diluted. If your priority is a high-ICSEA primary school, you need to know the exact catchment line. For secondary, a general sense of the area is usually sufficient.
What Creates These Cliffs
Not all boundary gaps are created equal. The 52 boundaries with gaps over 100 points cluster around specific geographic features:
Public housing boundaries (7 of the top 15): Debney Meadows, Carlton, Reservoir East, Glenroy. These are locations where public housing estates sit directly adjacent to gentrified or middle-class residential streets. The catchment boundary follows the estate perimeter. The ICSEA cliff is a direct readout of the income cliff.
Inner-city gentrification fronts (4 of the top 15): Fitzroy–Clifton Hill, Carlton–Carlton North, Preston. These are areas where gentrification has transformed one side of a boundary while the other retains its original working-class or mixed character. The ICSEA gap here is growing — it was likely smaller 10 years ago and will be smaller again in 10 years as gentrification spreads.
Beachside premiums (2 of the top 15): Brighton, with its beach-proximity wealth gradient. Streets closer to the beach are substantially wealthier than streets further inland, and the catchment boundary falls between them.
Hill communities (2 of the top 15): Sassafras–Ferny Creek, Kallista–Olinda. The Dandenong Ranges have pockets of alternative-lifestyle communities (lower ICSEA) adjacent to established leafy-suburb communities (higher ICSEA). Winding roads and steep terrain make catchment boundaries follow ridgelines, which also happen to separate communities.
Would Other Cities Show the Same Pattern?
This analysis uses Victorian catchment zones, but the dynamics are not unique to Melbourne. Every Australian state publishes school catchment boundaries, and ICSEA is calculated nationally using the same methodology. Sydney's inner west (Marrickville, Petersham, Dulwich Hill) has similar gentrification-front dynamics to Melbourne's inner north. Brisbane's northside/southside divide creates comparable socio-economic boundaries.
What likely differs is the number and magnitude of extreme boundaries. Melbourne's inner suburbs have a high density of public housing estates adjacent to gentrified streets, which produces the sharpest cliffs. Cities with more sprawling housing commission estates (e.g., outer Adelaide, outer Perth) may see larger distances between contrasting zones, reducing the boundary-level impact.
We plan to extend this analysis to NSW and Queensland catchment boundaries in upcoming articles. NSW publishes school catchment polygons through the NSW Department of Education, and we already have the ICSEA data for all states via ACARA.
How Boundary Gaps Change Over Time
One limitation of this snapshot analysis is that we cannot measure how these gaps are shifting. Gentrification-front boundaries (Carlton, Fitzroy, Reservoir, Preston) are likely narrowing as surrounding streets turn over and new families change the demographic mix. The 191-point Carlton–Carlton North gap may have been smaller 10 years ago and may be smaller again in 10 years.
Conversely, boundaries anchored by public housing (Debney Meadows, Brighton) are more stable. These gaps persist as long as the housing stock remains unchanged.
If ACARA released historical ICSEA data at the school level (they currently publish only the current year), tracking boundary gap trends over time would be a powerful tool for understanding neighbourhood change. We'll update this analysis as new ICSEA data is released annually.
Reading Boundary Gaps in Context
For families comparing properties near a catchment boundary, a few additional data points help put the ICSEA gap in perspective:
- NAPLAN relative to ICSEA: Does the school outperform its socio-economic prediction? ACARA publishes this comparison, and it's a more direct measure of educational value-add than the raw ICSEA score.
- The exact boundary line: Not the suburb or postcode, but the specific catchment polygon. Two houses in "Flemington" can fall in completely different school zones. Checking the precise boundary is essential near transition areas.
- Demographic trends: Catchment populations change over time. Areas undergoing demographic shifts may see their ICSEA scores move significantly within a few years, meaning today's gap may not reflect tomorrow's reality.
Explore Catchment Boundaries on the Map
All Victorian school catchment zones are visible on the DA Leads interactive map. Toggle the Schools & Childcare layer to see every government school coloured by ICSEA percentile, with catchment polygons overlaid. Click any school to see its ICSEA score, sector, enrolment, and exact catchment boundary.
Use it to check which catchment zone a specific address falls within — especially near boundary lines where the difference can be hundreds of ICSEA points.
Open the map with Schools & Catchment Zones →
Methodology
Catchment zones: Victorian Government School Catchment Zones (2025), published by the Department of Education. 1,158 primary and 235 secondary zone polygons with associated school identifiers.
ICSEA data: ACARA School Profile 2025. Linked to catchment zones via school name and ACARA ID.
Boundary pair identification: For each school zone polygon, we identified all adjacent zones (shared boundary segment). This produced 738 unique primary pairs and 134 secondary pairs.
Distance: Great-circle distance between school locations (latitude/longitude from ACARA data).
Extreme boundary filter: Gap > 150 ICSEA points AND distance < 3 km. This isolates boundaries where the cliff is sharp (high gap) and local (short distance), excluding rural zones where large distances make the comparison less meaningful.
Limitations:
- ICSEA currency: ICSEA is updated annually by ACARA. The 2025 values used here reflect 2024 enrolment demographics. Schools in rapidly changing areas may have ICSEA scores that lag demographic reality by 1-2 years, potentially understating or overstating the current boundary gap.
- Catchment boundary stability: Catchment boundaries are occasionally redrawn when new schools open, existing schools close, or the Department of Education redistributes capacity. A small number of boundary pairs in this analysis may have changed since the 2025 zone data was published.
- Mixed-level boundaries: Some boundary pairs involve schools at different levels (e.g., a secondary college adjacent to a primary school). We included these where the ICSEA comparison remains valid, but the educational context differs.
- No temporal comparison: Without historical ICSEA data at the school level, we cannot determine whether specific boundary gaps are growing, shrinking, or stable. The gentrification-front classification is based on qualitative assessment of neighbourhood change, not measured ICSEA trends.
- Distance as proxy: Great-circle distance between school locations approximates the boundary proximity but does not capture the actual street-level distance a family would walk. Two schools 1.1 km apart as the crow flies may be separated by a park, creek, or railway that creates a practical boundary.
- Victorian scope: This analysis covers Victorian catchment zones only. Other states publish catchment boundaries under different naming conventions and update schedules.
Sources
- ACARA — About ICSEA
- ACARA Data Access Program — School Profile 2025
- Victorian Government — Find My School (Catchment Zones)
- ACARA — Fact Sheet: About ICSEA
- DA Leads Interactive Map — Schools & Catchment Zones
- What ICSEA Actually Measures: A Data Analysis of 2,290 Victorian Schools
- Why QA7 Is the Most Common Weak Point in Melbourne Childcare
- Best School Zones in Melbourne (2026)


