
Western Australia rates 4.3% of its childcare services as Exceeding NQS. The ACT rates 43.0%. Same national standard. Same seven quality areas. Same assessment framework. A tenfold difference.
This is the most striking pattern in Australian childcare data, and it raises a question that matters for every parent interpreting NQS ratings: how much of an "Exceeding" rating reflects the service, and how much reflects which state assessed it?
We analysed all 17,014 rated childcare services in Australia to break down the seven quality areas by state. The results suggest the NQS is less nationally consistent than parents assume.
National Overview: 17,014 Services
| Rating | Count | Percentage |
|---|---|---|
| Exceeding NQS | 3,234 | 19.0% |
| Meeting NQS | 12,408 | 72.9% |
| Working Towards NQS | 1,372 | 8.1% |
Nearly three-quarters of services land at Meeting. That is the expected standard, and 73% of services are there. The interesting variation is in who exceeds and who falls short, and where.
The Seven Quality Areas: National Breakdown
| QA | Name | Exceeding | Exc % | Meeting % | Working % |
|---|---|---|---|---|---|
| QA6 | Partnerships with families | 3,930 | 23.1% | 75.9% | 1.0% |
| QA5 | Relationships with children | 3,455 | 20.3% | 78.0% | 1.7% |
| QA1 | Educational program | 3,319 | 19.5% | 75.8% | 4.7% |
| QA4 | Staffing arrangements | 2,808 | 16.5% | 81.7% | 1.8% |
| QA7 | Governance & leadership | 2,661 | 15.6% | 79.1% | 5.2% |
| QA3 | Physical environment | 2,578 | 15.2% | 82.8% | 2.1% |
| QA2 | Health & safety | 2,193 | 12.9% | 82.0% | 5.1% |
Two patterns are immediately visible:
QA6 is easiest to exceed, QA2 is hardest. Family partnerships (QA6) has the highest Exceeding rate at 23.1% and the lowest Working Towards rate at 1.0%. Health and safety (QA2) has the lowest Exceeding rate at 12.9% and a high Working Towards rate at 5.1%. The regulatory floor for health and safety is so prescriptive that exceeding it requires documented systems well beyond compliance.
QA7 is the biggest risk factor. Governance and leadership has the highest Working Towards rate at 5.2%. When a service fails its assessment, the problem is more likely to be management systems, quality improvement documentation, or leadership clarity than anything to do with how children are cared for.
The State Problem: Same Standard, Different Results
Here is the finding that complicates everything:
| State | Services | QA1 Exc | QA5 Exc | QA6 Exc | QA7 Exc | Overall Exc |
|---|---|---|---|---|---|---|
| ACT | 342 | 34.5% | 42.4% | 54.1% | 38.3% | 43.0% |
| SA | 1,274 | 23.1% | 28.6% | 28.7% | 22.3% | 24.2% |
| VIC | 4,600 | 23.5% | 27.2% | 28.0% | 17.1% | 23.4% |
| TAS | 227 | 21.1% | 21.6% | 27.3% | 19.4% | 20.3% |
| NSW | 5,786 | 21.0% | 18.4% | 23.1% | 16.7% | 19.2% |
| QLD | 3,168 | 15.4% | 16.0% | 18.4% | 12.2% | 14.8% |
| NT | 219 | 7.3% | 7.3% | 14.6% | 5.5% | 8.2% |
| WA | 1,398 | 4.2% | 4.0% | 5.3% | 3.6% | 4.3% |
This matters practically. If you move from the ACT to Perth, your child's new centre may have identical quality to their old one but a lower rating. If you are comparing centres across state lines, the rating is not an apples-to-apples comparison.
What Each Quality Area Actually Tells You
QA1: Educational Program and Practice (19.5% Exceeding)
This is what most parents care about: is the centre teaching my child well? QA1 assesses whether the centre has a documented curriculum based on the Early Years Learning Framework, whether educators observe and assess each child's learning, and whether the program is adapted based on those observations.
A centre Exceeding QA1 typically has: individual learning portfolios with photographic evidence, documented curriculum planning cycles, and educators who can articulate how specific activities connect to learning outcomes. Meeting QA1 means the centre does all of this at a baseline level. The difference is often in documentation depth and intentionality.
QA2: Health and Safety (12.9% Exceeding -- hardest)
The hardest quality area to exceed. QA2 covers supervision ratios, hygiene protocols, illness management, allergy procedures, sun safety, sleep practices, and nutrition. The regulatory requirements are already detailed and prescriptive.
To exceed QA2, a centre typically needs to demonstrate practices that go beyond regulatory requirements: for example, a documented nutrition policy that exceeds the Australian Dietary Guidelines, or an illness management protocol that includes staff training logs and parent communication templates. The bar is high because the baseline is already high.
QA5: Relationships with Children (20.3% Exceeding)
QA5 assesses whether educators treat children with dignity and respect, whether interactions are warm and responsive, and whether children are supported to develop autonomy. It is the quality area most directly observable during an assessment visit: assessors watch how educators talk to children, respond to emotions, and manage behaviour.
The 20.3% Exceeding rate and 1.7% Working Towards rate make QA5 one of the most consistent quality areas. Very few centres fail it, and a meaningful proportion exceed it. This is arguably the quality area that matters most for a child's daily experience.
QA7: Governance and Leadership (15.6% Exceeding, 5.2% Working Towards -- riskiest)
The quality area most likely to pull a service down to Working Towards. QA7 assesses management structures, quality improvement processes, philosophy documentation, and leadership effectiveness. It is the most "back office" of the seven areas: a centre can have excellent educators and a warm environment and still fail QA7 because its quality improvement plan is not documented, or its governance structure is unclear.
For parents, a Working Towards in QA7 is less immediately concerning than one in QA2 or QA5. Your child's daily experience may be fine. But governance failures tend to compound: a centre with poor management systems is more likely to develop problems in other areas over time.
Cross-QA Relationships
Nationally, services that exceed QA1 (educational program) almost always exceed QA5 (relationships) as well. The two areas share a common driver: skilled, experienced educators who stay at the same centre long enough to build relationships with children and deliver a coherent curriculum.
QA6 (partnerships) has the weakest correlation with the other areas. A centre can be Meeting on everything else and Exceeding on QA6 simply by being good at parent communication. This makes QA6 the least informative individual indicator: it tells you the centre communicates well, not necessarily that it educates well.
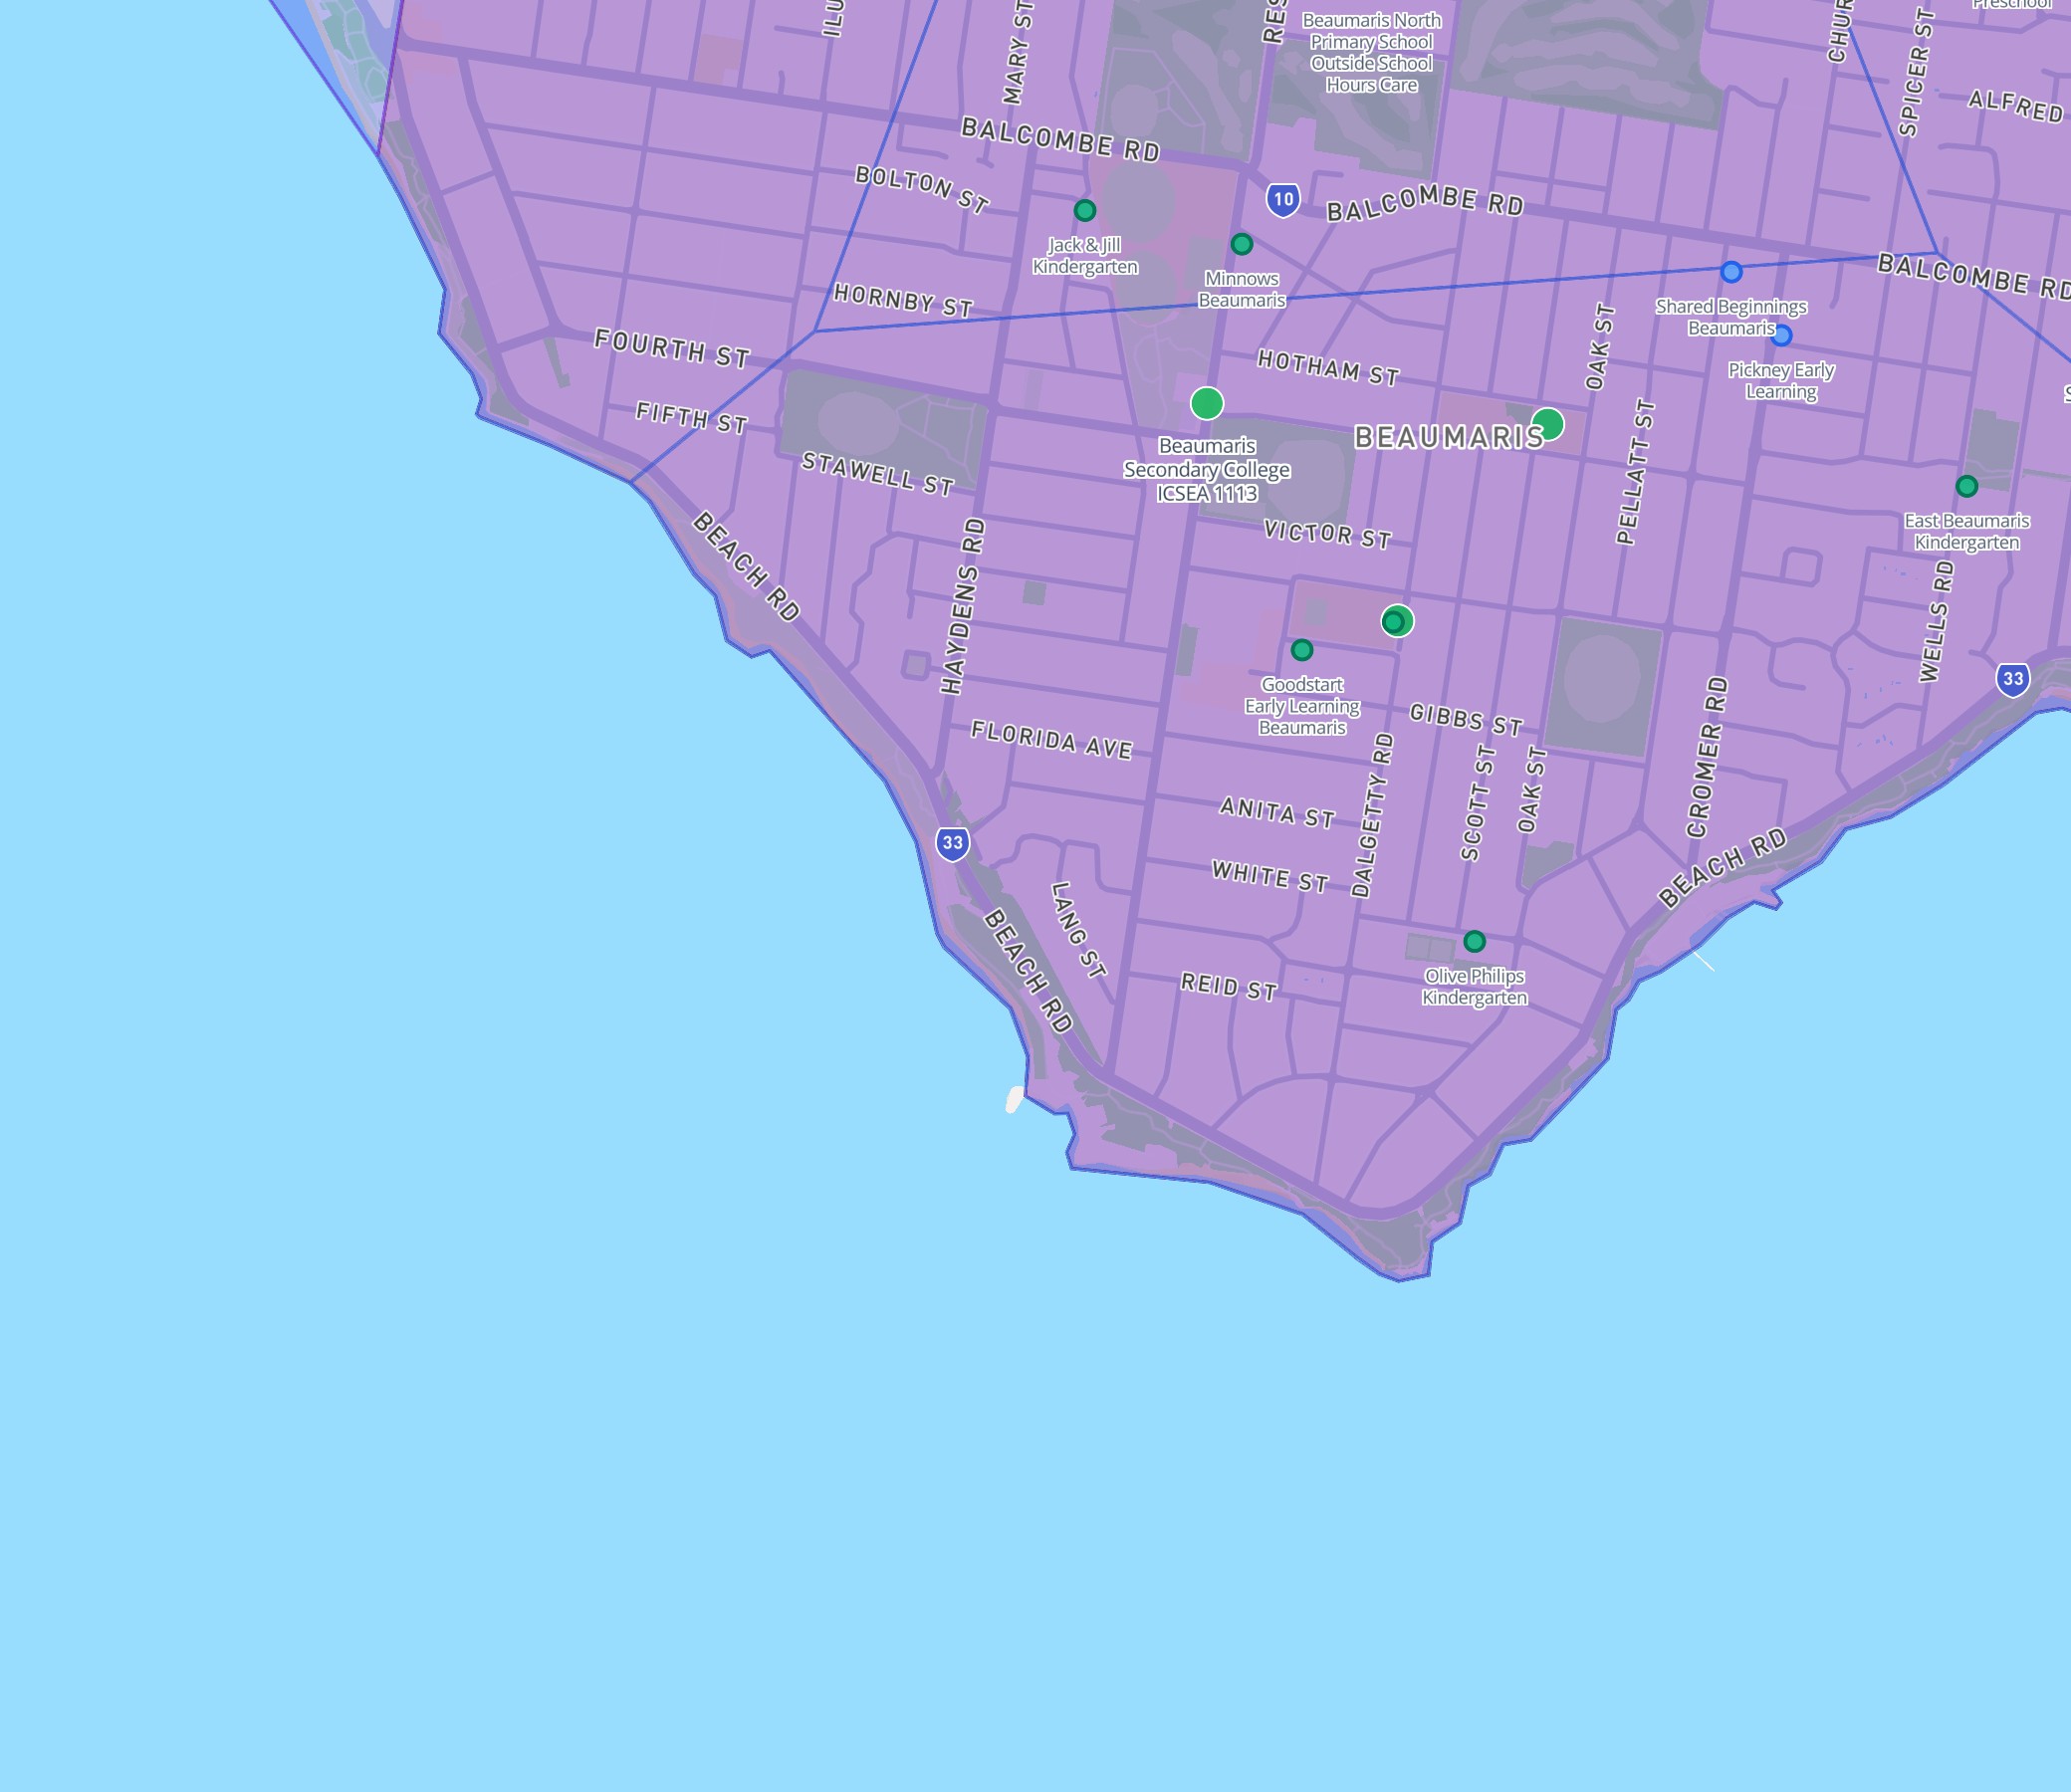
Beaumaris on the DA Leads map: 9 childcare services, 78% Exceeding NQS. Almost all markers are green. Compare with growth corridor suburbs where the mix is predominantly yellow (Meeting) with red (Working Towards) outliers.
How to Use NQS Ratings in Practice
- Check QA1 and QA5 first. These most directly reflect your child's daily experience.
- Don't panic about QA7. A governance failure is a management problem, not a teaching problem. It is usually fixed within one reassessment cycle.
- Compare within your state. A "Meeting" in WA may be equivalent to an "Exceeding" in the ACT, given the tenfold variation in assessment rates.
- Zero Working Towards matters. A suburb where every centre is Meeting or Exceeding is safer than one with a few Exceeding and a few Working Towards.
- Regional centres are often stronger. Don't assume metro means better. The data consistently shows the opposite.
Explore Any Service's QA Breakdown
The DA Leads interactive map shows every childcare service in Australia with its NQS rating. Click any marker to see individual quality area scores.
Open the interactive map with Schools & Childcare layer
Methodology
Data source: ACECQA National Register, 17,014 rated services across all states and territories. QA scoring: Each quality area rated on the same scale as overall (Exceeding = 4, Meeting = 3, Working Towards = 2). State comparison: Calculated as percentage of services in each state receiving each rating level. Limitations: Assessments conducted by state regulatory authorities, not a national body. Assessment frequency and interpretation may vary. Ratings are point-in-time.


