
There are 100 childcare services in Melbourne currently rated "Working Towards NQS," meaning they haven't yet met the national standard. We analysed their quality area scores to identify which areas are most commonly below the benchmark.
In 71 of those 100 services, QA7 — governance and leadership — is below standard. The pattern holds across different service types, ages, and sizes. Governance is where childcare services most commonly fail to keep up as they grow.
The Seven Quality Areas, Ranked by Failure Rate
Every childcare service in Australia is assessed on seven quality areas. When a service fails to meet the overall standard, it's usually because one or two specific areas pulled the rating down. Here's how often each quality area appears as a weak point in Melbourne's 100 Working Towards services:
| Quality Area | Description | Below Standard | % of Failing Services |
|---|---|---|---|
| QA7 | Governance & leadership | 71 | 71% |
| QA2 | Children's health & safety | 64 | 64% |
| QA1 | Educational program & practice | 51 | 51% |
| QA3 | Physical environment | 28 | 28% |
| QA5 | Relationships with children | 22 | 22% |
| QA4 | Staffing arrangements | 11 | 11% |
| QA6 | Collaborative partnerships | 4 | 4% |
QA7 is the most common weak point by a wide margin. But here's what makes it structurally different from the others: QA7 is the most common sole reason a service fails.
Of the services that were pulled below standard by just one weak area (everything else Meeting or Exceeding), QA7 was that sole weak area in 13 cases. QA2 was the sole cause in 11 cases. QA1 in 3. No other quality area was the sole reason for more than 1 failure.
This means QA7 isn't just correlated with failure. It's the single point of failure that, on its own, drags otherwise competent services below the standard.
What QA7 Actually Assesses
QA7 covers governance, management, and leadership. Specifically:
- 7.1 Governance: The service's governance structure supports its operation, ensures accountability, and manages risk.
- 7.2 Leadership: There is effective leadership that promotes a positive organisational culture and builds a professional learning community.
This isn't about whether kids are happy or whether the building is safe. It's about whether someone is running the place properly. Are policies current? Is there a quality improvement plan? Are complaints handled? Is the service financially sustainable? Is the leadership team capable?
It's the business and management side of childcare, and the data suggests it's where many services face the greatest challenge.
New Centres Are Worse at Governance
The data shows a clear relationship between service age and QA7 performance.
| Service Age | Services | QA7 Avg | Exceeding QA7 | Working Towards QA7 |
|---|---|---|---|---|
| 0-2 years | 60 | 3.05 | 4 (6%) | 1 (1%) |
| 2-5 years | 439 | 3.03 | 27 (6%) | 14 (3%) |
| 5-10 years | 557 | 3.13 | 81 (14%) | 9 (1%) |
| 10-15 years | 2,399 | 3.22 | 566 (23%) | 49 (2%) |
Services in their first five years have a QA7 Exceeding rate of just 6%. Services that have been operating for 10-15 years achieve Exceeding at 23%, nearly four times higher.
This isn't because older services were always good. It's because governance takes time to build. A new service has to develop policies, build a professional learning culture, establish complaints processes, and create a quality improvement cycle. These are institutional capabilities that can't be imported on day one, no matter how experienced the director is.
The implication for growth corridors is direct. Suburbs like Craigieburn (44 services), Tarneit (41 services), and Point Cook (39 services) have seen rapid expansion of childcare provision. Many of these services are young. And young services, regardless of location, are structurally disadvantaged on governance.
Bigger Centres Are Worse at Governance (Until They're Very Big)
Service size tells a less intuitive story.
| Approved Places | Services | QA7 Avg | Exceeding QA7 |
|---|---|---|---|
| 1-30 | 478 | 3.27 | 140 (29%) |
| 31-60 | 1,003 | 3.19 | 205 (20%) |
| 61-100 | 1,046 | 3.17 | 189 (18%) |
| 101-150 | 721 | 3.13 | 107 (14%) |
| 150+ | 121 | 3.23 | 30 (24%) |
Small services (1-30 places) have the highest QA7 scores: 29% Exceeding. As services grow to 60, 100, then 150 places, QA7 performance drops steadily. But then it recovers at 150+ places.
The pattern makes sense when you think about what governance actually requires. A small family daycare or boutique centre has a simple governance structure. One director, a handful of staff, straightforward policies. Governance is manageable because the operation is manageable.
As centres grow to 60-150 places, governance complexity increases faster than governance capacity. You need more policies, more risk management, more staff coordination, more regulatory compliance. Centres in this growth phase may not yet have built the management infrastructure to match their operational scale.
The recovery at 150+ places suggests that the very largest centres (often chains or institutional operators) have the resources to hire dedicated compliance and management staff. They've professionalised their governance in a way that mid-sized centres haven't.
This creates a structural problem for the childcare market. The most common centre size in Melbourne is 61-100 places (1,046 services), and that's exactly the size range with the weakest governance.
Which Quality Area Actually Predicts Overall Performance?
Not all quality areas are equally important to the overall rating. We calculated the correlation between each QA score and the overall rating across all 3,455 Melbourne services:
| Quality Area | Description | Correlation (r) | R² |
|---|---|---|---|
| QA1 | Educational program | 0.886 | 0.785 |
| QA4 | Staffing arrangements | 0.844 | 0.713 |
| QA5 | Relationships with children | 0.838 | 0.702 |
| QA7 | Governance & leadership | 0.818 | 0.668 |
| QA6 | Collaborative partnerships | 0.793 | 0.629 |
| QA3 | Physical environment | 0.764 | 0.583 |
| QA2 | Children's health & safety | 0.738 | 0.544 |
QA1 (educational program and practice) is the strongest predictor of overall performance, explaining 78.5% of the variation. QA7 is fourth at 66.8%.
This means two things. First, QA7 is the most common point of failure, but QA1 is the most important driver of excellence. Services that want to move from Meeting to Exceeding should focus on their educational program, not just fix their governance paperwork.
Second, the services that are excellent (Exceeding overall) tend to be excellent across the board. QA1, QA4, QA5, and QA7 are all tightly correlated. You rarely see a service that's brilliant at education but terrible at governance. Good management enables good teaching, and vice versa.
The Suburbs Where Governance Is the Weakest Link
In 23 Melbourne suburbs, QA7 is the lowest-scoring quality area across all services. These are places where governance is the specific bottleneck holding childcare quality back.
| Suburb | QA7 Avg | Best Other QA | Gap | Services |
|---|---|---|---|---|
| Kealba | 2.75 | 3.50 | -0.75 | 4 |
| Tyabb | 2.75 | 3.50 | -0.75 | 4 |
| Alphington | 3.00 | 3.50 | -0.50 | 8 |
| Williams Landing | 3.00 | 3.50 | -0.50 | 6 |
| Narre Warren North | 2.88 | 3.25 | -0.38 | 8 |
| Ringwood | 3.12 | 3.44 | -0.31 | 16 |
| Caroline Springs | 2.94 | 3.25 | -0.31 | 16 |
| Melbourne CBD | 3.00 | 3.27 | -0.27 | 11 |
| Epping | 2.93 | 3.18 | -0.25 | 28 |
Epping stands out: 28 services, and QA7 is the weakest area across the board. The services there perform adequately on education, health, and relationships (all averaging above 3.0), but governance scores lag behind the other quality areas.
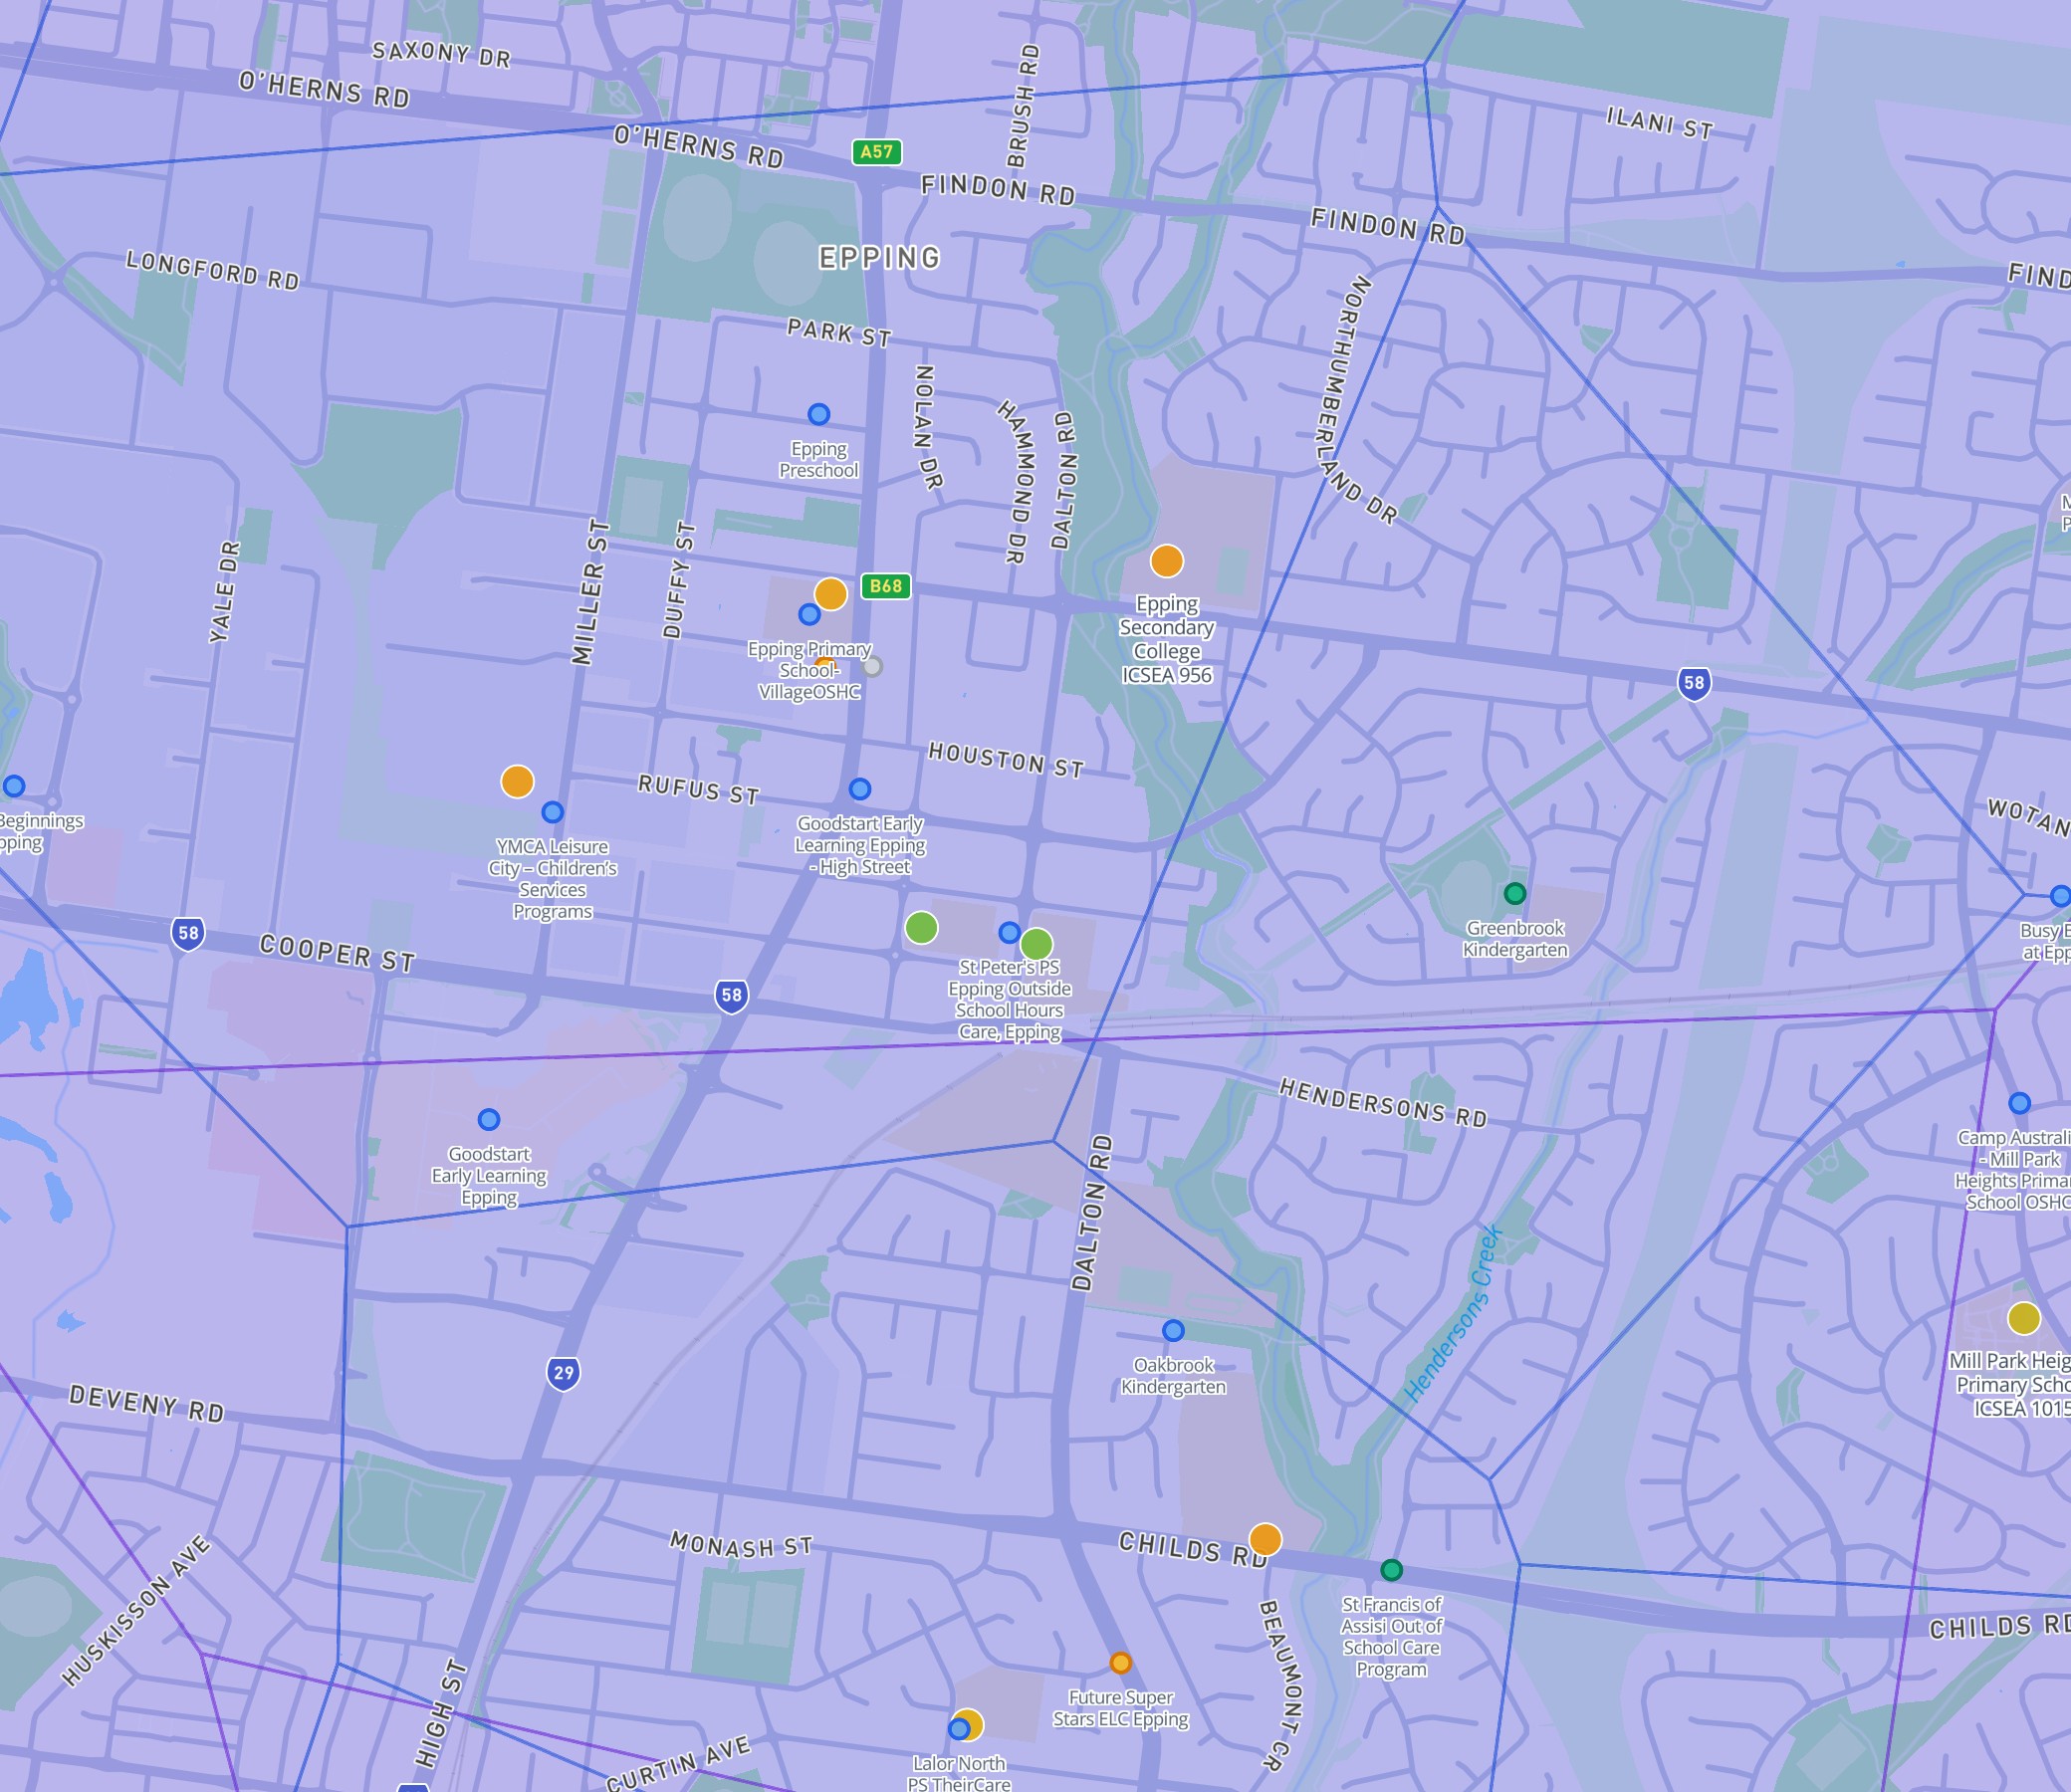
Caroline Springs (16 services, QA7 avg 2.94) and Narre Warren North (8 services, QA7 avg 2.88) show the same pattern: these are growth-corridor suburbs where childcare provision has scaled faster than management quality.
How Assessment Timing Affects These Numbers
One important caveat: ACECQA does not reassess every service on a fixed schedule. According to ACECQA: "Services with a lower quality rating will be re-rated more frequently. Services with higher quality ratings will generally have a longer period of time between assessment and rating visits." (ACECQA — The Rating System)
This means some ratings in this analysis may be several years old. A service rated Working Towards in 2022 may have improved significantly since then but not yet been reassessed. Conversely, an Exceeding-rated service from 2021 may have experienced staff turnover or management changes that aren't reflected in its current rating.
The age and size patterns we've identified are less affected by this timing issue, since they reflect averages across thousands of services. But the suburb-level data (e.g., Epping's 28 services) should be read with the understanding that individual ratings may not reflect current quality.
Is QA7 a Melbourne Problem or a National One?
Our analysis covers Melbourne's 3,455 rated services, but the QA7 pattern is likely national. The National Quality Standard and assessment framework are identical across all states and territories. The governance requirements — quality improvement plans, policy documentation, complaints processes, risk management — are the same whether a service operates in Melbourne, Sydney, or Perth.
What may vary between cities is the age profile of services (newer cities like parts of outer Brisbane and Perth have younger service populations) and the prevalence of chain-operated centres (which tend to perform better on QA7 at scale). Extending this analysis nationally would clarify whether growth corridors in other cities show the same governance gap.
What This Means
For parents: QA7 is unlikely to affect your child's daily experience directly. Your child won't notice whether the centre has a current quality improvement plan. But QA7 failures are a leading indicator. A centre that can't manage governance often develops problems in other areas over time. If a service you're considering is rated Working Towards, check which quality areas are below standard. If QA7 is the sole weak area, the centre may deliver a perfectly good educational experience while it sorts out its paperwork. If QA1 or QA5 are weak, that's a different conversation.
For operators: The mid-size governance gap (61-150 places) is real and addressable. If your centre has grown past 60 places and you haven't invested in dedicated compliance or quality improvement processes, you're in the highest-risk size bracket. The data says your QA7 is likely your weakest area.
For developers: If you're building childcare facilities in growth corridors, factor in the maturation curve. A new centre takes 5-10 years to build governance to the level where Exceeding is realistic. Marketing a development with "future childcare centre" is different from marketing it with "established, Exceeding-rated childcare."
Check Childcare Quality Areas on the Map
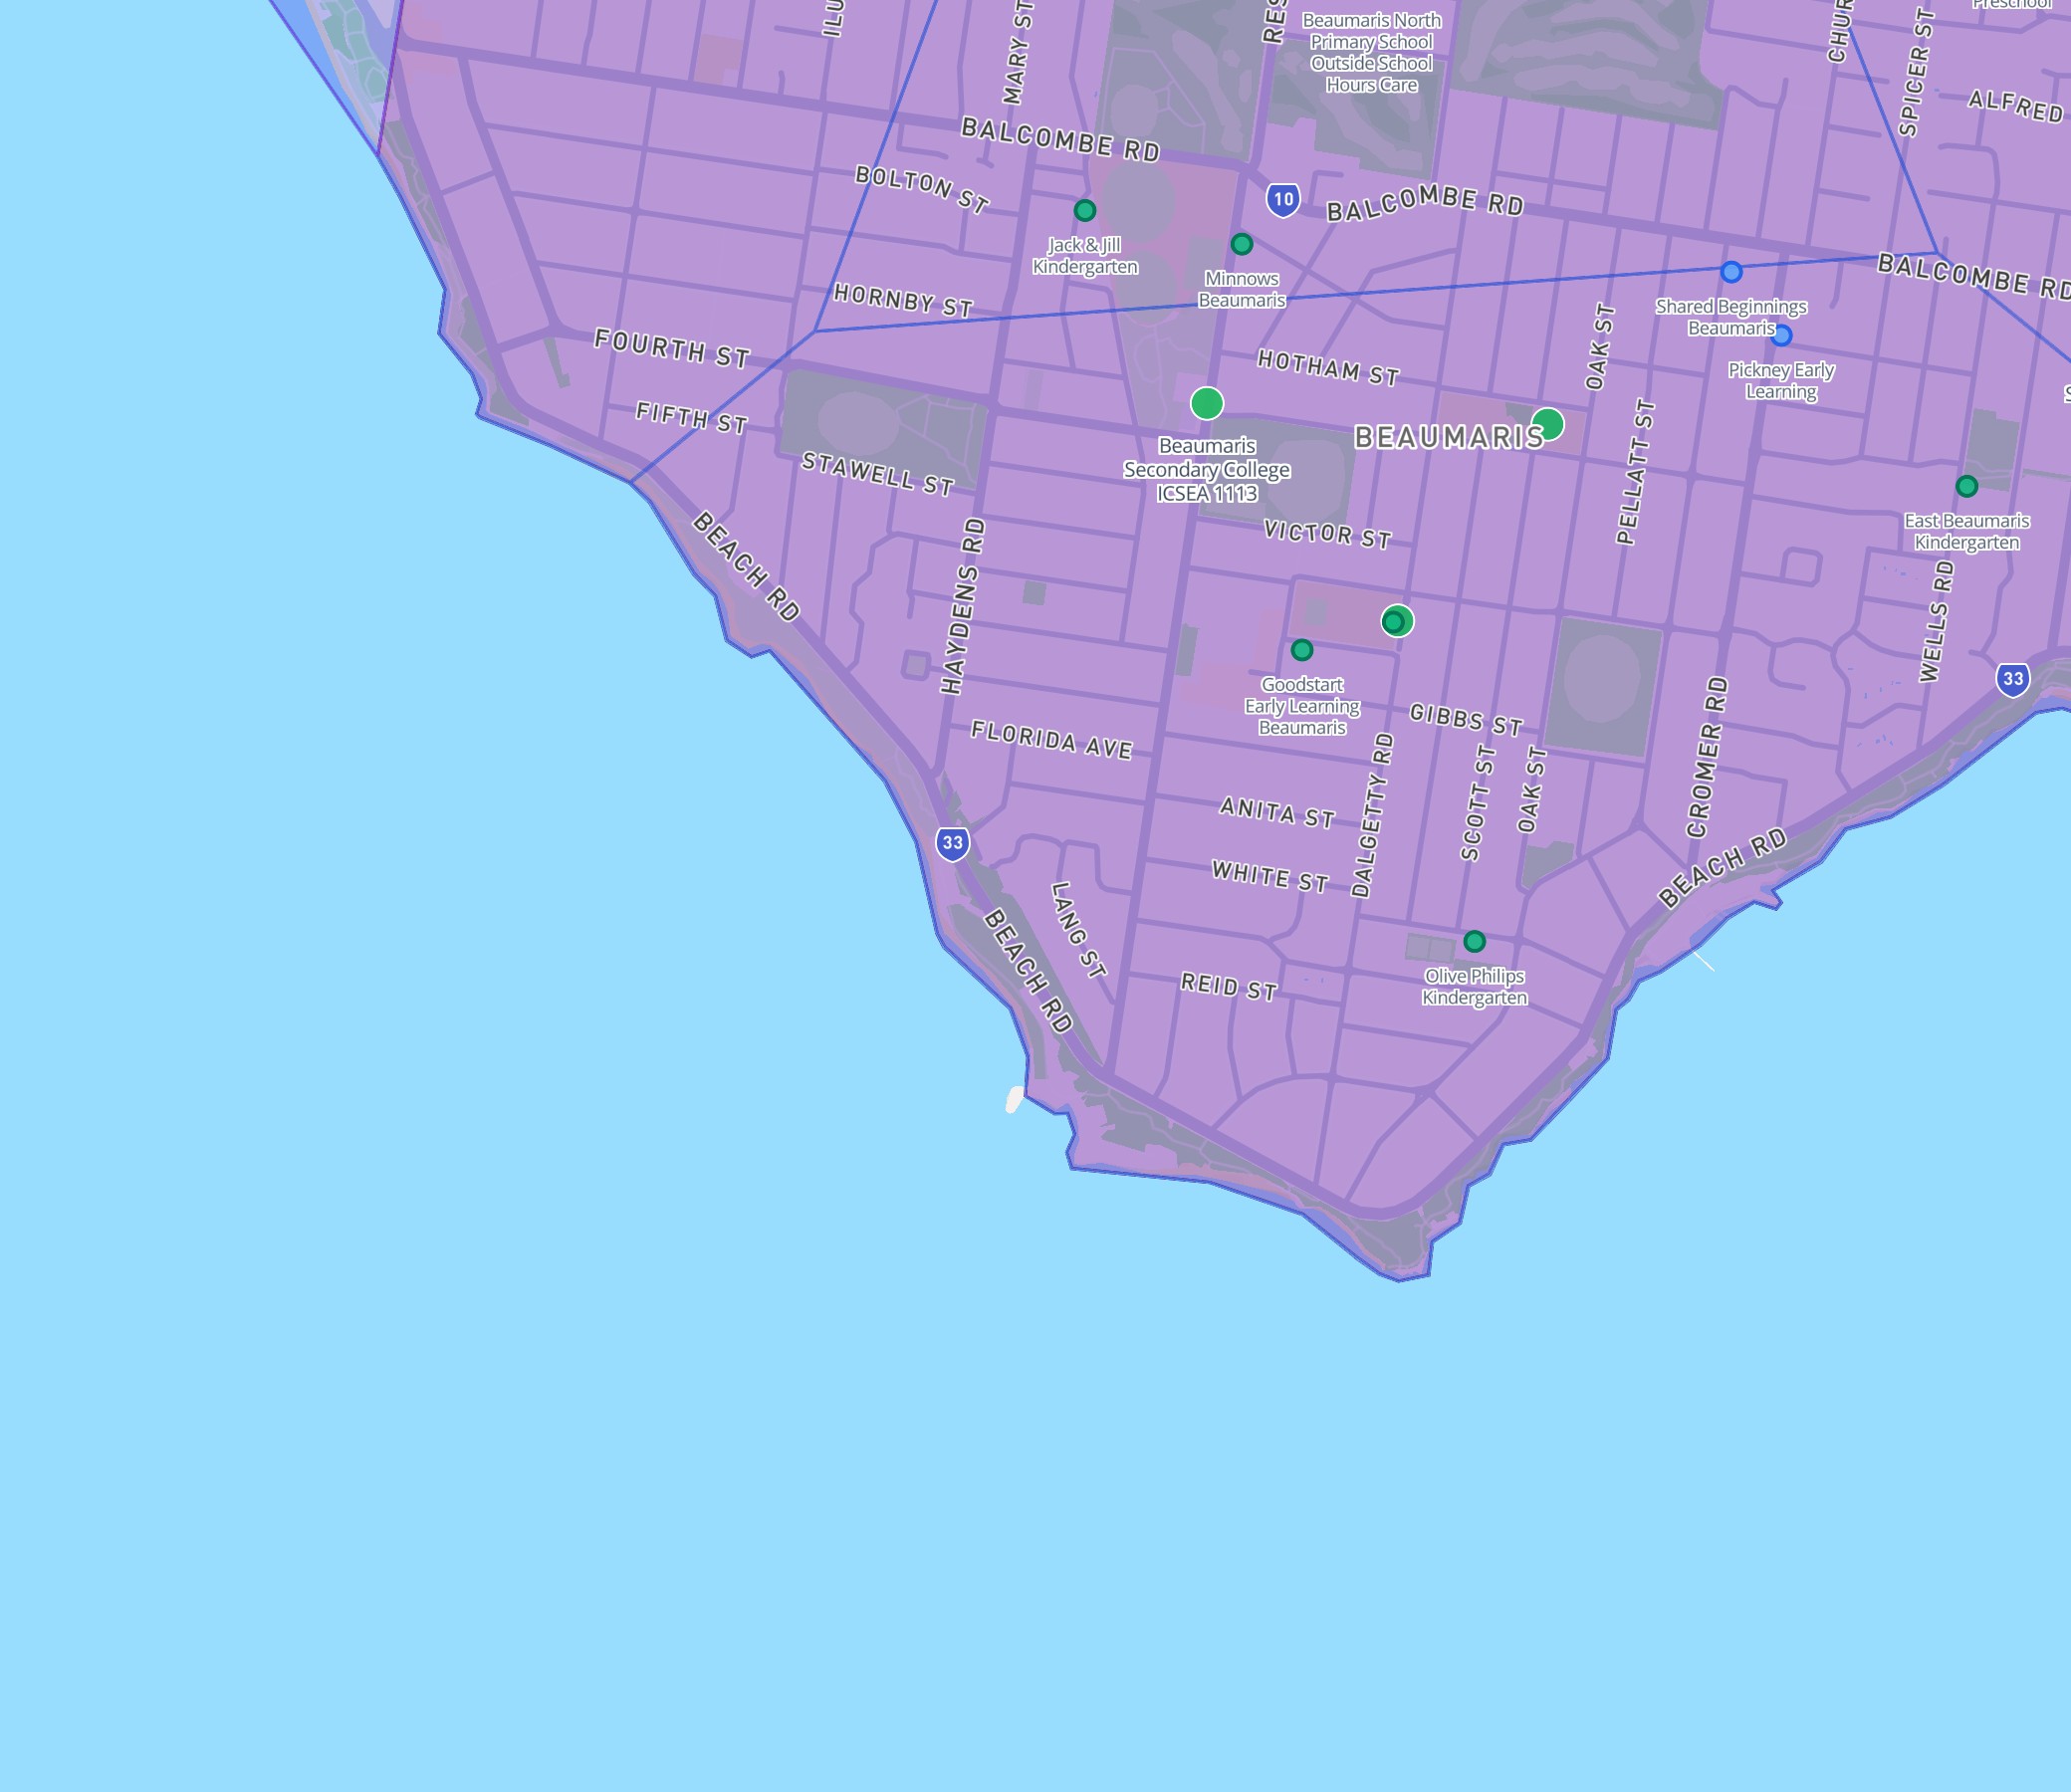
All childcare NQS ratings and quality area scores are available on the DA Leads interactive map. Click any childcare service to see its overall rating and quality area breakdown. Toggle the Schools & Childcare layer to compare services across suburbs.
Open the map with Schools & Childcare layer →
Methodology
Data source: ACECQA National Register, 3,455 rated childcare services in the Greater Melbourne area (lat -38.5 to -37.4, lng 144.4 to 145.8).
Failure analysis: 100 services rated "Working Towards NQS." For each, we counted how many of the seven quality areas scored below Meeting (score 1 or 2). "Sole weak QA" means only one quality area was below Meeting while all others were Meeting or Exceeding.
Service age: Calculated from the ACECQA-registered approval date to May 2026. Services without a recorded approval date were excluded from age analysis.
Correlation: Pearson correlation between individual QA scores and overall NQS rating (numeric scale) across all 3,455 services.
Suburb QA7 analysis: Required a minimum of 3 services with QA7 scores. QA7 was classified as "weakest" if its suburb average was lower than all other six quality areas.
Limitations:
- Assessment timing: NQS ratings are point-in-time assessments. ACECQA uses a risk-based reassessment schedule, meaning some ratings may be 3-5 years old. Services may have improved or declined since their last assessment. This analysis treats all current ratings as equally weighted regardless of assessment date.
- Geographic scope: This analysis covers Greater Melbourne only. National patterns may differ, particularly in states with different service age profiles or regulatory enforcement approaches.
- Survivorship bias: Services that fail badly enough may close entirely, meaning the 100 Working Towards services in this analysis represent those that are still operating. The true failure rate of governance in new or mid-sized centres may be higher than these numbers suggest.
- No temporal comparison: We analyse a single snapshot. Without historical QA7 data (comparing 2020 vs 2025 ratings for the same services), we cannot confirm whether governance is improving or deteriorating over time. The age-based pattern (newer = weaker) could reflect either a maturation curve or a cohort effect.
Sources
- ACECQA National Register — Service Ratings
- ACECQA — Quality Area 7: Governance and Leadership
- ACECQA — Guide to the National Quality Framework
- ACECQA — The Rating System (reassessment frequency)
- DA Leads Interactive Map — Schools & Childcare Layer
- What ICSEA Actually Measures: A Data Analysis of 2,290 Victorian Schools
- Best Childcare in Melbourne: NQS Ratings (2026)
- 1,523 Childcare Centre DAs in 12 Months: The Site-Selection Data


