Ballina, a coastal town five hours north of Sydney, has the best childcare in New South Wales. Seven of its nine rated services are Exceeding NQS. Its nearest competitor on the list is not in Sydney's North Shore or Eastern Suburbs. It is Kiama, another regional town, two hours south.
This is not a coincidence. Across all 5,786 rated childcare services in NSW, regional centres are 32% more likely to be rated Exceeding than Sydney metro centres. The relationship between suburb affluence and childcare quality is weaker than most parents expect.
The Metro-Regional Inversion
| Region | Services | Exceeding | Exc % | Meeting % | Working Towards % |
|---|---|---|---|---|---|
| Sydney metro | 3,652 | 628 | 17.2% | 76.1% | 6.7% |
| Regional NSW | 2,134 | 484 | 22.7% | 70.1% | 7.3% |
Regional NSW does have a marginally higher Working Towards rate (7.3% vs 6.7%), reflecting a few very small services in remote areas. But the top-end quality difference overwhelms this: regional areas produce proportionally more excellent centres.
NSW's Top 30 Suburbs by Childcare Quality
These suburbs have the highest average NQS ratings (minimum 5 rated services):
| Rank | Suburb | Services | Avg NQS | Exceeding | Exc % | Working |
|---|---|---|---|---|---|---|
| 1 | Ballina | 9 | 3.78 | 7 | 78% | 0 |
| 2 | Green Point | 6 | 3.67 | 4 | 67% | 0 |
| 3 | Kiama | 8 | 3.62 | 5 | 62% | 0 |
| 4 | Bateau Bay | 5 | 3.60 | 3 | 60% | 0 |
| 5 | Gorokan | 5 | 3.60 | 3 | 60% | 0 |
| 6 | Bulli | 7 | 3.57 | 4 | 57% | 0 |
| 7 | Lilyfield | 9 | 3.56 | 5 | 56% | 0 |
| 8 | Crows Nest | 9 | 3.56 | 5 | 56% | 0 |
| 9 | Wauchope | 9 | 3.56 | 5 | 56% | 0 |
| 10 | Wallsend | 8 | 3.50 | 5 | 62% | 1 |
| 11 | Cronulla | 10 | 3.50 | 5 | 50% | 0 |
| 12 | Mount Colah | 6 | 3.50 | 3 | 50% | 0 |
| 13 | Ulladulla | 6 | 3.50 | 3 | 50% | 0 |
| 14 | Turramurra | 13 | 3.46 | 6 | 46% | 0 |
| 15 | Brookvale | 13 | 3.46 | 6 | 46% | 0 |
| 16 | Pymble | 11 | 3.45 | 5 | 45% | 0 |
| 17 | Manly | 9 | 3.44 | 4 | 44% | 0 |
| 18 | Newtown | 9 | 3.44 | 4 | 44% | 0 |
| 19 | Bondi Junction | 15 | 3.40 | 6 | 40% | 0 |
| 20 | Lismore | 12 | 3.42 | 5 | 42% | 0 |
Six of the top nine suburbs are regional. The first metro suburbs to appear are Lilyfield and Crows Nest, tied at 7th with 56% Exceeding.
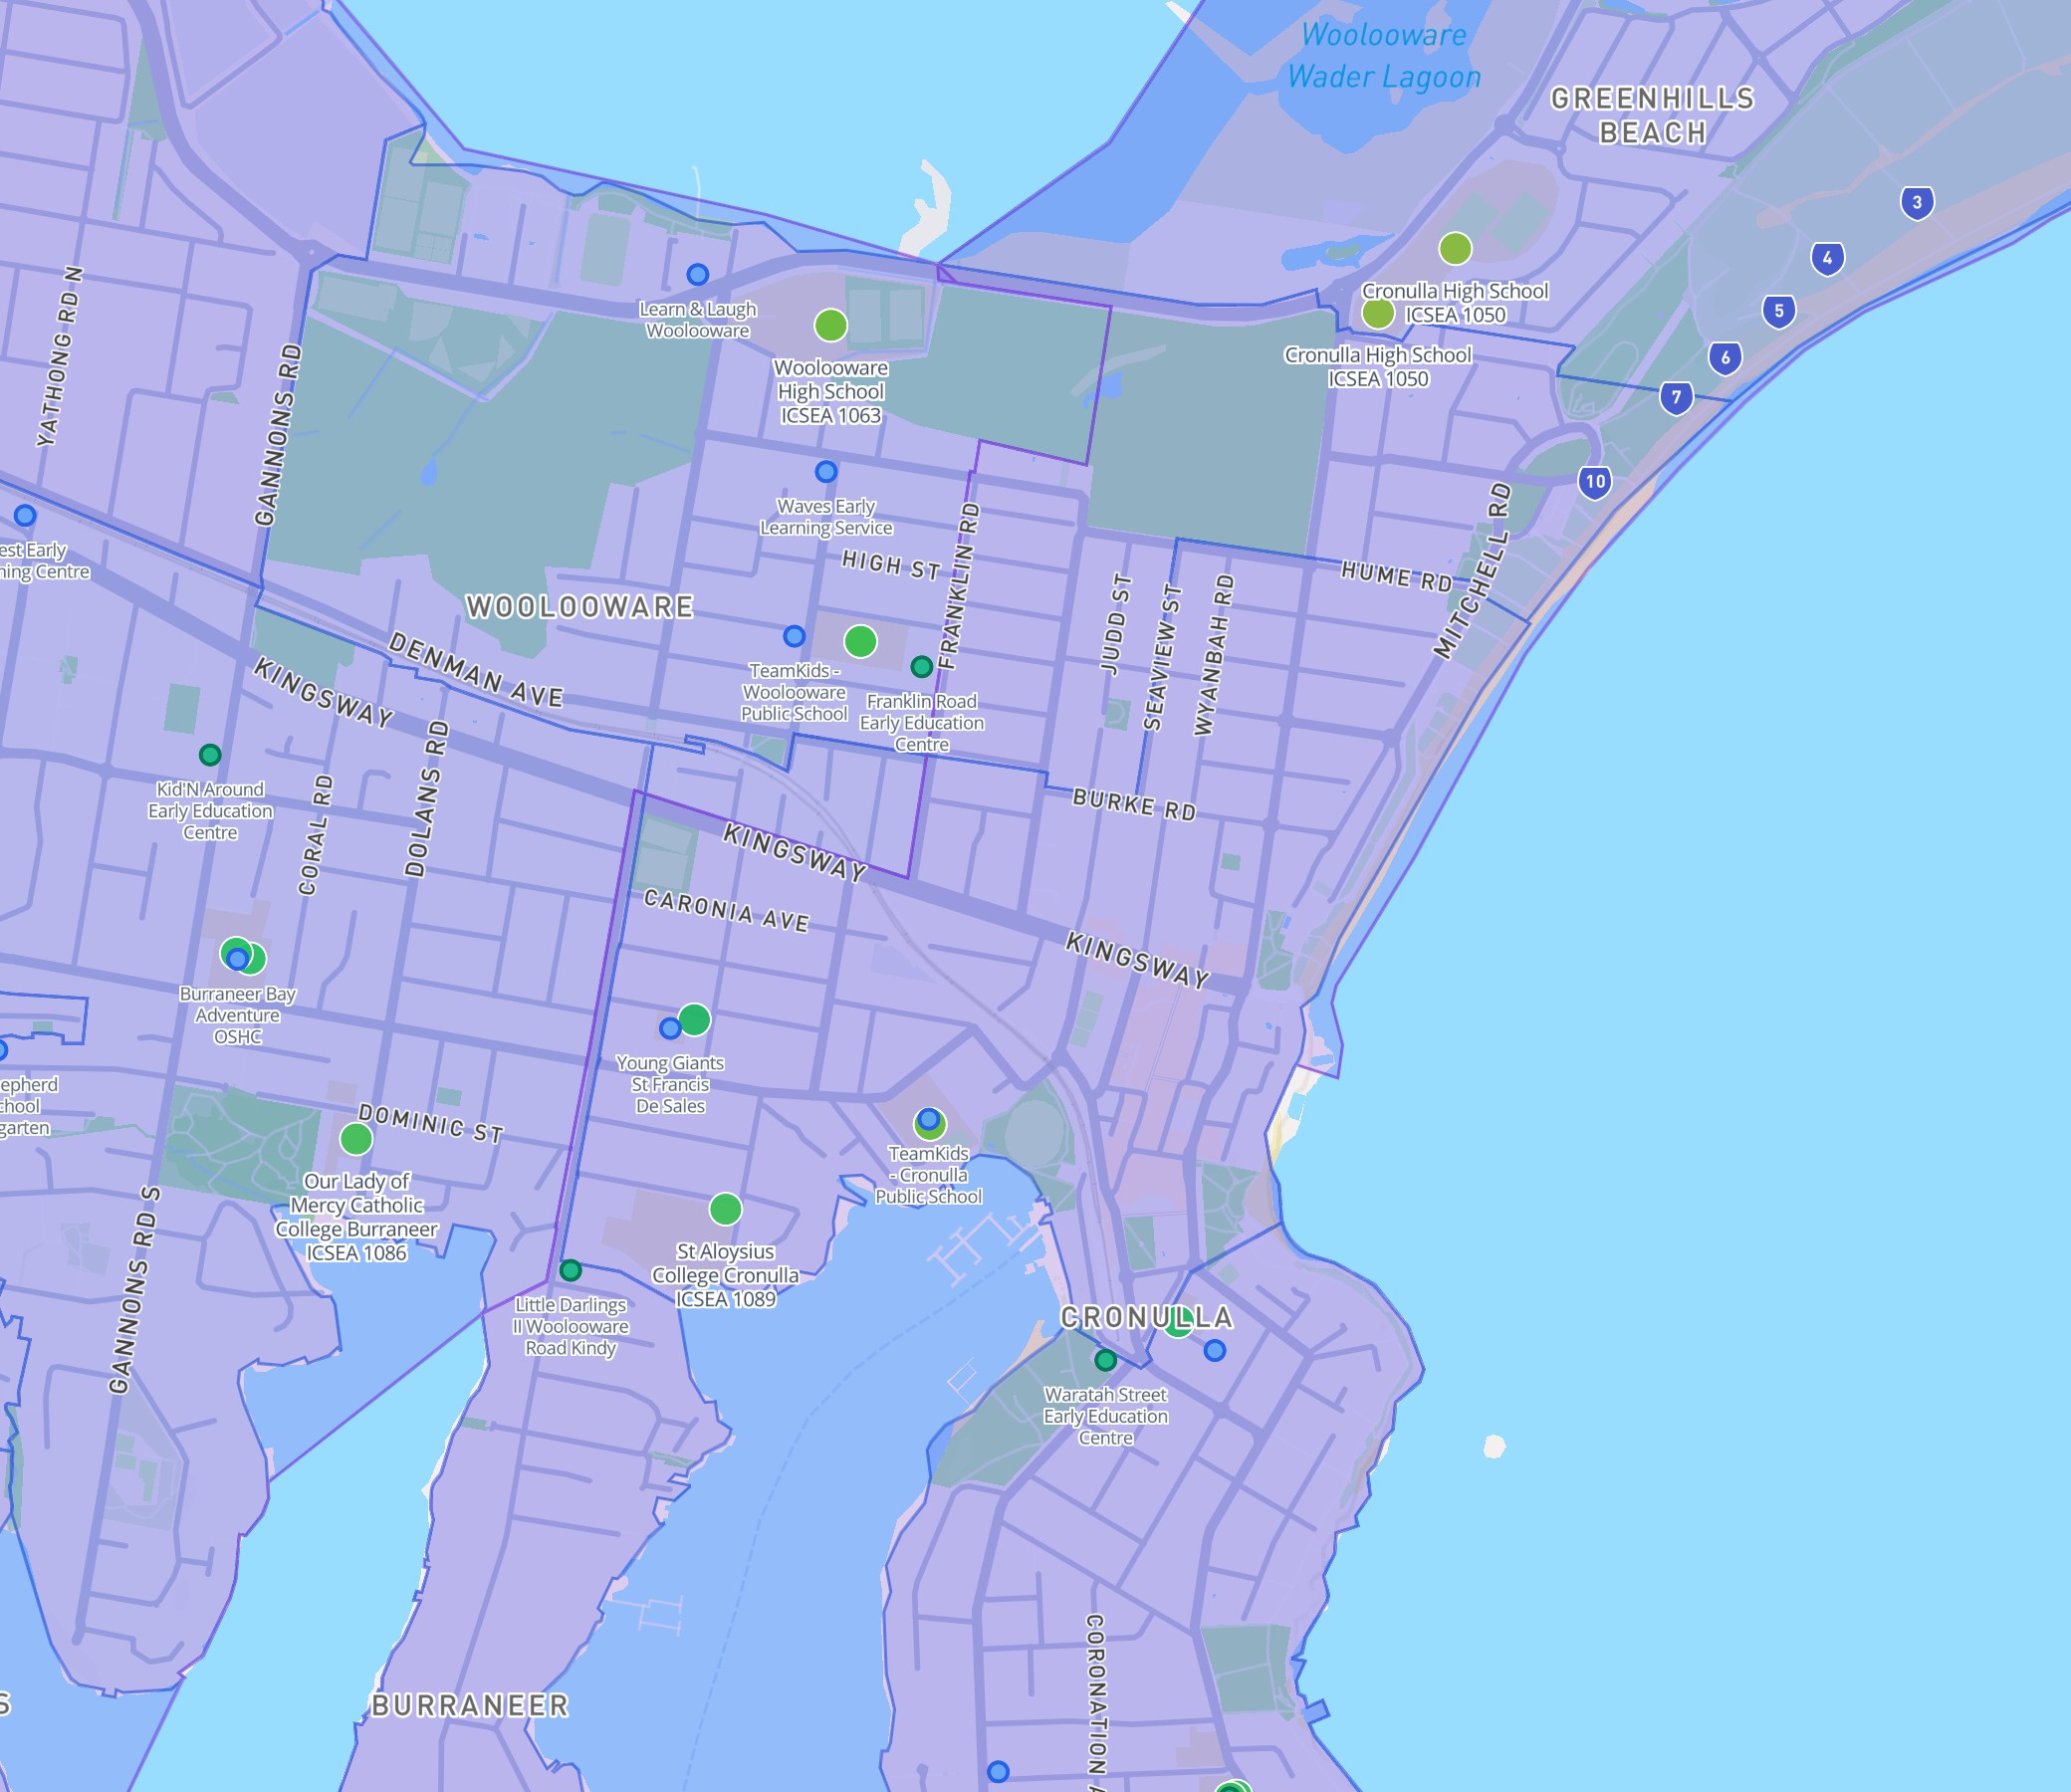
Cronulla on the DA Leads map: 10 childcare services, 50% rated Exceeding NQS (green markers), zero Working Towards. The strongest childcare quality of any triple-strong suburb in Sydney.
The Zero Working Towards Pattern
The top 13 suburbs on this list have zero services rated Working Towards NQS. Every single centre in those suburbs meets or exceeds the national standard.
This is a more useful signal than the Exceeding percentage. A suburb with 50% Exceeding and 0% Working Towards is a very different proposition from one with 50% Exceeding and 15% Working Towards. The first has a high floor. The second has a wide spread.
For parents, the absence of poor performers matters as much as the presence of excellent ones. You are unlikely to choose the best centre in a suburb. You are more likely to end up at whichever one has a spot. In a suburb with zero Working Towards, that centre will be at least Meeting NQS regardless.
NSW Childcare by the Quality Areas
Every service is assessed on seven quality areas. Across all 5,786 NSW services:
| QA | Name | Exceeding % | Meeting % | Working % |
|---|---|---|---|---|
| QA6 | Partnerships with families | 23.1% | 75.9% | 1.0% |
| QA1 | Educational program | 21.0% | 75.8% | 4.7% |
| QA5 | Relationships with children | 18.4% | 78.0% | 1.7% |
| QA7 | Governance & leadership | 16.7% | 79.1% | 5.2% |
| QA3 | Physical environment | 14.8% | 82.8% | 2.1% |
| QA4 | Staffing | 14.6% | 81.7% | 1.8% |
| QA2 | Health & safety | 14.0% | 82.0% | 5.1% |
The pattern matches the national data: QA6 (partnerships) is easiest to exceed; QA2 (health and safety) is hardest. QA7 (governance) has the highest failure rate at 5.2%.
The Volume Champions
Sydney's largest suburbs by childcare count tell a story about growth corridors:
| Suburb | Services | Avg NQS | Exceeding % |
|---|---|---|---|
| Parramatta | 20 | 3.00 | 5% |
| Castle Hill | 31 | 3.26 | 26% |
| Baulkham Hills | 32 | 3.13 | 19% |
| Randwick | 21 | 3.19 | 19% |
| St Ives | 22 | 3.18 | 23% |
| Chatswood | 19 | 3.05 | 11% |
| Mosman | 19 | 3.11 | 11% |
| Wahroonga | 18 | 3.17 | 22% |
| Hornsby | 18 | 3.11 | 11% |
Castle Hill delivers both volume and quality: 31 services, 26% Exceeding. Parramatta has 20 services but only 5% Exceeding, a challenging suburb for parents seeking top-rated care.
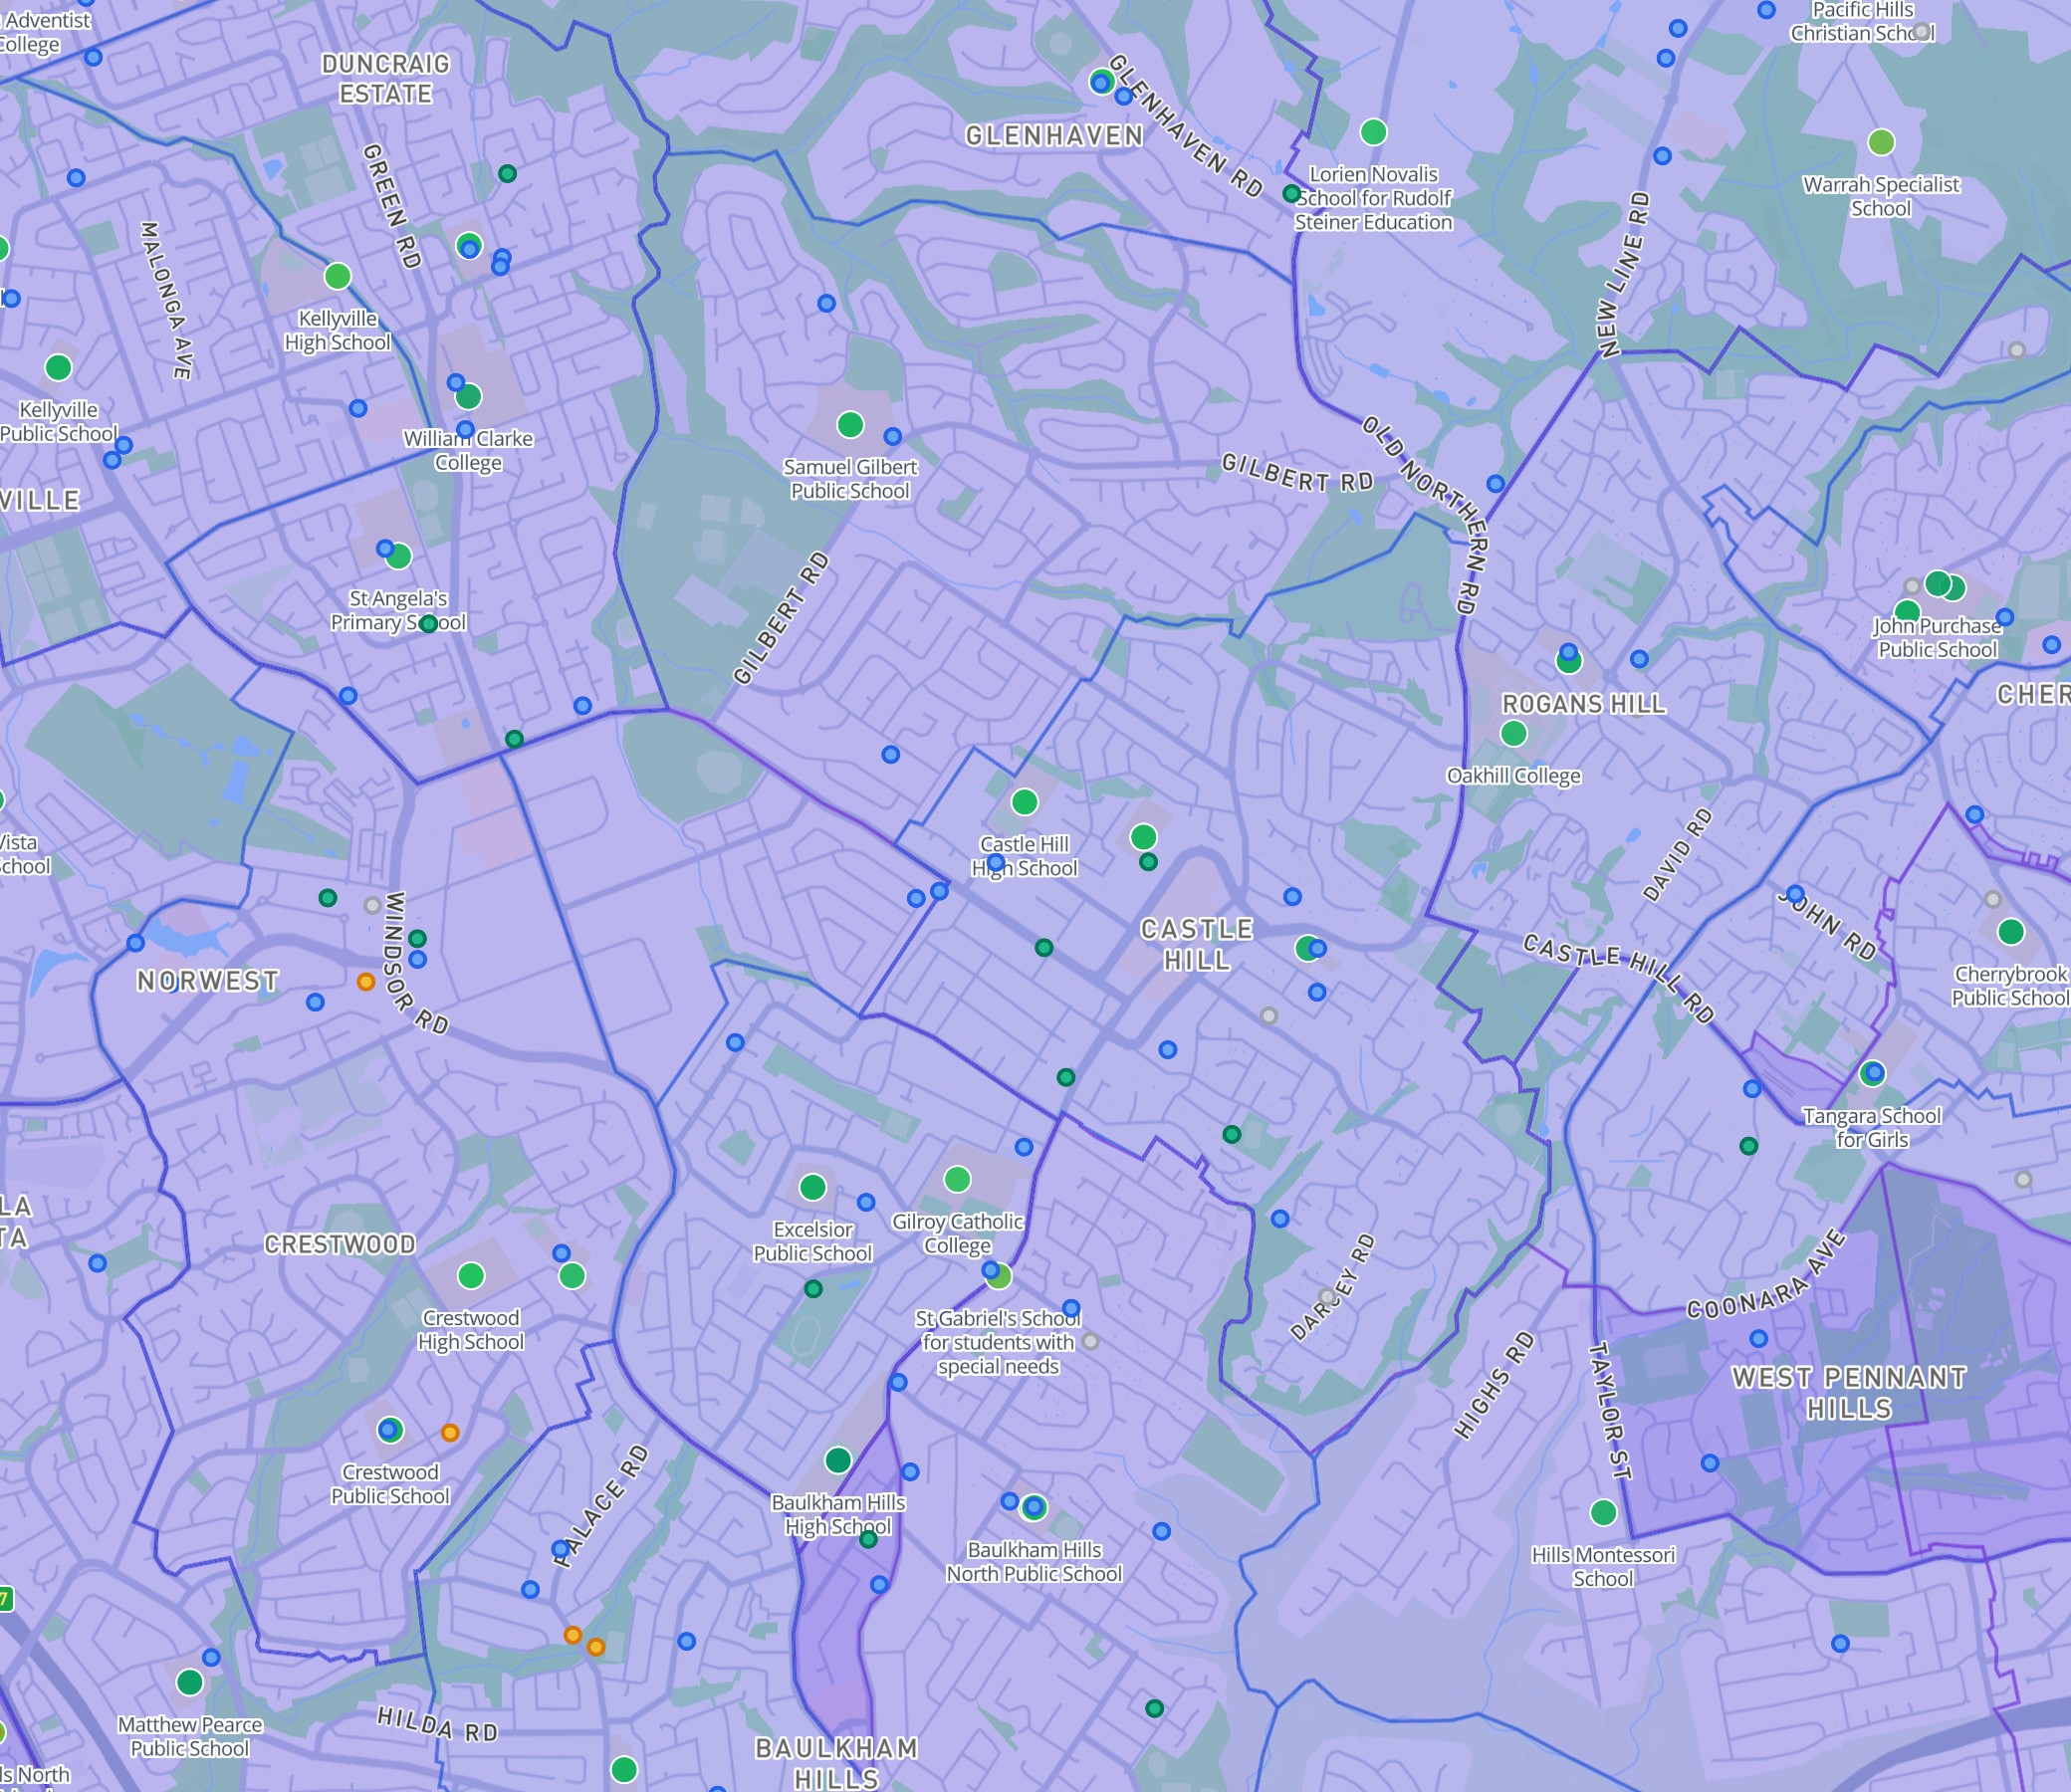
Castle Hill and Baulkham Hills on the DA Leads map: over 60 childcare services combined, the highest-volume childcare corridor in Sydney. Green = Exceeding, yellow = Meeting. Click any marker for the full QA breakdown.
Explore Childcare Data on the Map
All childcare data is available on the DA Leads interactive map. Each service is colour-coded by NQS rating. Click any marker for the full QA breakdown.
Open the interactive map with Schools & Childcare layer
Methodology
Data source: ACECQA National Register, 5,786 rated services in NSW. Metro/regional split: Sydney metro defined as lat -34.2 to -33.4, lng 150.5 to 151.5 (3,652 services). Everything else is regional (2,134 services). Rating scale: Exceeding = 4, Meeting = 3, Working Towards = 2. Minimum 5 services for suburb ranking table. Limitations: NQS ratings are point-in-time assessments. They do not capture availability, waitlist length, or staff turnover.