
NSW and Victoria are still the two biggest visible markets in the DA Leads public dataset, but they are not strong in the same way. NSW wins on scale. Victoria wins on mix.
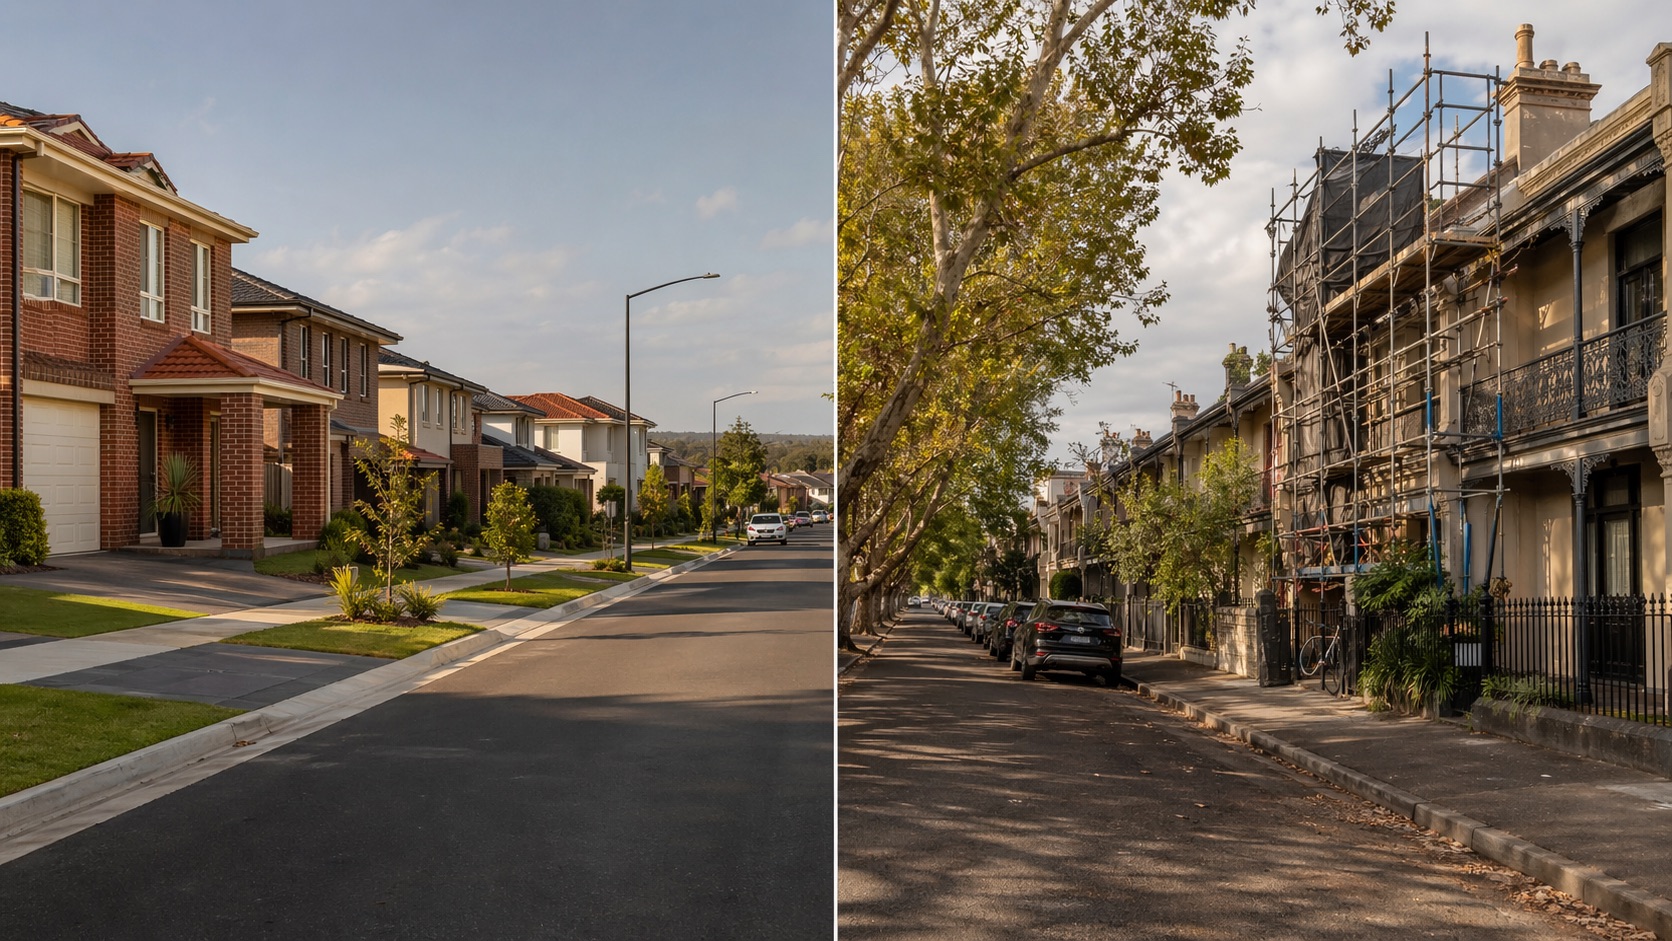
Two markets, two profiles: Sydney's outer-western growth estates (left) versus Melbourne's inner-ring renovation and infill streets (right). The raw DA count tells you one story; the work mix tells another.
The Fast Answer
The current public insights pages show:
- NSW:
10,327development applications - Victoria:
4,758development applications
NSW is carrying more than double the visible volume. But raw count hides something: adjust for population (ABS estimates NSW at 8.4M vs Victoria at 6.8M as of September 2025) and the per-capita gap narrows to roughly 1.5:1 instead of 2.2:1. Victoria is filing more DAs per resident than the headline numbers suggest.
Why NSW Looks Bigger
The NSW public insights page reflects a broader visible pipeline across a larger council footprint. Multiple active outer-growth belts (South West Sydney, North West, Hunter, Illawarra) feed a steady stream of residential approvals. Add the established metro councils and the regional spread, and there are simply more visible corridor options to work across.
For builders who want volume and repetition, NSW's advantage is breadth.
Where Victoria Punches Above Its Weight
Victoria's lower total hides a couple of things that matter to specialist trades.
First, the work mix leans harder into renovation, demolition, tree removal permits, and medium-density infill. These are jobs that require more specialist quoting and less cookie-cutter pricing.
Second, individual Victorian councils can rival the biggest NSW councils on sheer output. Whittlesea and Casey regularly appear in the top 10 nationally for visible DAs, sitting alongside much larger NSW LGAs like Blacktown and Camden. If you work in Melbourne's outer growth corridors, the pipeline density per council is comparable to anything in Sydney's west.
Third, ABS building approval data (catalogue 8731.0, December quarter 2025) shows Victoria consistently approving more multi-unit dwellings as a share of total approvals than NSW. For trades focused on townhouses, duplexes, and missing-middle builds, Victoria's approval mix runs hotter than the raw DA count implies.
| Factor | NSW | Victoria |
|---|---|---|
| Visible DA count | 10,327 | 4,758 |
| Per-capita rate (per 100k residents) | ~123 | ~70 (closer than raw count suggests) |
| Multi-unit share of approvals | Lower | Higher (ABS 8731.0, Dec 2025) |
| Pipeline profile | Growth-area residential, broad council spread | Renovation, demolition, medium-density, permit friction |
| Best suited for | Builders wanting volume and repetition | Specialist trades wanting permit-heavy or niche work |
| Top council output | Blacktown, Camden, Liverpool | Whittlesea, Casey, Wyndham |
The Real Difference: Scale vs Mix
The useful way to read this comparison is not "which state is bigger" but "which pipeline shape fits my business."
NSW gives you more councils to scan and more raw volume in each corridor. If you run a team across multiple LGAs and need a steady flow of similar jobs, NSW's spread works in your favour.
Victoria compresses more variety into fewer councils. A single LGA like Yarra Ranges can surface renovation permits, demolition notices, and medium-density proposals in the same week. That density of mixed work is harder to find in any single NSW council outside inner Sydney.
What This Means for Tradies
A volume builder running crews across outer-suburban estates will find more runway in NSW. That is straightforward.
The less obvious play is for specialist trades: if you do heritage renovations, demolition, or multi-unit fit-outs, Victoria's pipeline punches harder per council than the state-level numbers suggest. And if you work across both states, the real question is not "which is better" but which corridors match the jobs you actually quote on.
The Better Way to Use This Comparison
Do not use NSW vs Victoria as a one-line conclusion.
Use it to ask:
- Do I need more volume or better fit?
- Do I work best in growth corridors or established suburbs?
- Is my trade more exposed to residential repetition or permit-heavy specialist work?
Those questions turn a state-level stat into a real operating decision.
The Bottom Line
NSW leads on raw visible DA volume. But once you adjust for population and look at approval mix, Victoria closes the gap more than most people expect. The right question is not "which state has more DAs" but "which pipeline shape matches the work I actually win."
View NSW insights, view VIC insights, or see all states to compare the current public pipeline yourself.
Sources and Further Reading
- DA Leads NSW insights
- DA Leads Victoria insights
- DA Leads national insights
- DA Leads councils directory
- ABS Building Approvals, Australia (8731.0) - state-level dwelling approval breakdowns
- ABS National, state and territory population (3101.0) - population estimates used for per-capita calculation


