Carbrook
At median age 46, Carbrook skews 6 years older than the national figure, making it one of Logan's most established owner-occupier pockets. Household income sits in the 74.6th percentile nationally, and the suburb scores decile 8 on both IRSAD and IRSD, placing it well above average advantage despite modest dwelling prices. What stands out is the ownership culture: 48% of homes are owned outright, more than twice the renter share of 16.4%, pointing to a long-settled community rather than a transient one. With 77.7% separate houses and 56.7% of dwellings having 4 or more bedrooms, the suburb clearly favours families who came, bought and stayed.
Population
1,330
Median Age
46.0
Household IncomeiMedian weekly household income (ABS Census)
$1,989/wk
DAs (12 months)iDevelopment Applications lodged in the past year
47
Median House
$576K
Estimated from rent (2025)
The estimated median house price of $576,000 is affordable compared to the broader Brisbane market, and the ownership structure reflects that appeal: 48% own outright and only 35.7% carry a mortgage. Monthly mortgage repayments average $2,600, producing a mortgage-to-income ratio of 30.2%, which sits just above the standard 30% stress threshold. Stock is overwhelmingly detached houses at 77.7%, with 56.7% of dwellings having 4 or more bedrooms, making it well suited to families seeking space. Apartments represent just 1.4% of stock, so buyers looking for units will find very limited choice. Rent-to-income runs at 18.9%, well below the 30% stress level, meaning the small renter cohort is relatively comfortable.
For Buyers
The estimated median house price of $576,000 is affordable compared to the broader Brisbane market, and the ownership structure reflects that appeal: 48% own outright and only 35.7% carry a mortgage. Monthly mortgage repayments average $2,600, producing a mortgage-to-income ratio of 30.2%, which sits just above the standard 30% stress threshold. Stock is overwhelmingly detached houses at 77.7%, with 56.7% of dwellings having 4 or more bedrooms, making it well suited to families seeking space. Apartments represent just 1.4% of stock, so buyers looking for units will find very limited choice. Rent-to-income runs at 18.9%, well below the 30% stress level, meaning the small renter cohort is relatively comfortable.
For Investors
The investment case in Carbrook is modest but steady. Weekly rent of $375 against a $576,000 median implies a gross yield around 3.4%, lower than many regional QLD markets but supported by a stable, owner-dominated suburb. The 5% vacancy rate is elevated and warrants attention, suggesting landlords face more competition than average. Renter share is only 16.4%, so the tenant pool is thin. On the demand side, net overseas migration drives around 72 arrivals a year while internal migration shows a slight outflow of 7, giving net positive growth. Development activity reached 42 applications in the past 12 months, mostly residential additions, indicating modest but ongoing reinvestment. Rent growth of 21.4% over the recent period confirms pricing momentum even without high transaction volumes.
Development Activity
Total DAs
95
Last 12 Months
47
YoY ChangeiYear-over-year change in DA lodgements
+235.7%
Avg DA CostiAverage estimated cost per DA in the past year
N/A
Monthly DA Lodgements
DA Categories
Schools in Carbrook iICSEA: school advantage index. 1000 = national avg, higher = more advantaged
Kimberley College
Prep-12 · 745 students
Carbrook State School
Prep-6 · 333 students
Carbrook Animal Assisted Learning Centre
7-12 · 40 students
Demographics
Carbrook's median age of 46 sits 6 years above the national median, consistent with its aging trajectory: the senior share rose 7.4 points over the decade while the working-age share fell 3.9 points. Overseas-born residents make up 18.6% of the population, 3 points below the national figure, and ancestry is strongly Anglo-Celtic, led by English (595 residents), Scottish (170) and Irish (139). Average household size of 2.8 is 0.3 above the national figure, reflecting the prevalence of family households: 370 couples with children vs 299 couples without. University qualifications reach 24.8%, which is 5.3 percentage points below the national rate, consistent with a workforce concentrated in trade and care sectors. Volunteering sits at 13.7%, and 7.8% of residents need daily assistance, the latter partly reflecting the older age profile.
Age Distribution
Bedrooms
Dwelling Structure
77.7%
Houses
2.6%
Townhouse
1.4%
Apartment
Tenure
The housing stock is dominated by detached homes at 77.7%, with apartments at just 1.4% and semi-detached at 2.6%. The size distribution leans large: 56.7% of dwellings have 4 or more bedrooms, well above what you find in inner or middle-ring suburbs. Tenure is unusually ownership-heavy: 48% own outright, 35.7% carry a mortgage, and only 16.4% rent. This high outright-ownership rate signals a long-established community with low debt levels. Mortgage stress (30.2% of income) is at the boundary but rent stress (18.9%) is comfortably below the national concern threshold. The estimated median house price of $576,000 represents solid value compared to state and national medians for detached, large-lot properties.
Mortgage / mo
$2,600
Rent / wk
$375
HH Size
2.8
Personal Income / wk
$748
Vacancy Ratei% of dwellings unoccupied on Census night (ABS 2021)
5.0%
Unoccupied
23
Rent / IncomeiMedian rent as % of household income. Over 30% = housing stress
18.9%
Mortgage / IncomeiMedian mortgage as % of household income. Over 30% = housing stress
30.2% stressed
Community Profile
Ancestry
Household Composition
27.8%
Couples, no children
1,075
Total families
Economy & Employment
Construction is by far the dominant industry at 22.7% of employed residents (92 workers), more than double the next sector, Healthcare at 15.6% (63 workers). Education follows at 9.9% and Public Administration at 6.2%. By occupation, Professionals (109) and Clerical/Admin workers (107) lead, with Managers at 85 and Labourers at 82. The full-time employment rate of 64.1% is solid, with an unemployment rate of 4.1% and a participation rate of 56.3%, the lower participation partly explained by the high share of retirees and those not in the labour force (396 residents). Carbrook scores decile 8 on IRSAD and IRSD, placing it above average on both advantage and disadvantage measures compared to QLD and nationally. Real income grew 11.2% over the decade.
Unemployment
1.3%
Labour Force
5,637
Unemployed
74
Quarterly Trend
Source: SALM Dec-25
Socio-Economic Indexes (SEIFA)iABS index ranking suburbs from 1 (most disadvantaged) to 10 (most advantaged)
Full-time
64.1%
Part-time
31.8%
Participation
56.3%
Employed
602
Occupations
Top Industries
University
24.8%
Postgraduate
4.6%
Born Overseas
18.6%
Dwellings
426
Transport to Work
Carbrook is almost entirely car-dependent: 91.5% of residents drive to work, and only 0.7% use public transport, far below the national average. This reflects the suburb's low-density, semi-rural layout across 22.84 sq km, which is large relative to its 1,330 residents. No schools are recorded within the suburb boundary, so families depend on nearby Logan area schools. The IRSAD decile 8 score places Carbrook above average nationally on the combined index of advantage and disadvantage, while the IER score of decile 10 reflects strong housing asset values among residents. The vacancy rate of 5% and mortgage stress just above 30% are the main livability concerns, though the high outright-ownership rate of 48% means most residents carry no housing debt at all.
Drive
91.5%
Public Transport
0.7%
Walk / Cycle
1.8%
Work from Home
N/A
Population Forecast
+0.83%/yr
(+79 people/yr)
EstablishedPopulation grew 13% over the decade and is tracking at 0.83% annually, adding around 79 people per year. The primary driver is overseas migration at 72 net arrivals per year, while internal migration runs at a slight deficit of 7. The medium-scenario forecast projects growth from around 9,471 in 2025 to 9,999 by 2031, modest but consistent. The suburb is classified as established with an aging trajectory, and the gentrification score of 28 signals only early signs of change rather than active transformation. Affordability improved from 53.7% in 2011 to 47.6% in 2021, moving in the right direction compared to many QLD suburbs that worsened over the same period. Resident stability is high: 77.3% stayed in the same address over the census period, compared to more transient growth corridors.
Historical + Forecast
Hamilton-Perry + Holt smoothing on ERP 2001-2025
Age Cohort Forecast
Primary Driver
Overseas Migration
Net Overseas / yr
+72
Net Internal / yr
-7
Gentrification Signal
Not gentrifying
Population +13% since 2011
National Ranking iPercentile rank among ~15,000 AU suburbs. 90% = higher than 90% of suburbs
How Carbrook compares to ~15,000 Australian suburbs
Frequently Asked Questions
Is Carbrook a good suburb to live in?
Carbrook suits families and established owner-occupiers well. Household income sits in the 74.6th percentile nationally, the suburb scores decile 8 on IRSAD, and 48% of homes are owned outright. The main trade-offs are limited public transport (0.7% usage) and no schools recorded within the boundary.
What is the median house price in Carbrook?
The estimated median house price is $576,000 as at 2025, derived from rent data. Monthly mortgage repayments average $2,600, and the mortgage-to-income ratio of 30.2% sits just at the standard stress threshold. Weekly rent averages $375 for the 16.4% of residents who rent.
What schools are in Carbrook?
No schools are recorded within the Carbrook suburb boundary in this dataset. Residents rely on schools in neighbouring Logan and Redland suburbs. Despite this, 24.8% of adults hold university qualifications, though this is 5.3 points below the national average.
Is Carbrook safe?
Specific crime statistics for Carbrook are not available in this dataset. As an indirect indicator, the suburb scores decile 8 on the IRSD index of relative disadvantage nationally, placing it well above average, and household income is in the 74.6th percentile, both consistent with a low-disadvantage area.
Is Carbrook good for property investment?
Weekly rent of $375 against a $576,000 median gives a gross yield near 3.4%, modest but positive. Rent grew 21.4% over the recent period, indicating pricing momentum. The 5% vacancy rate is a caution sign, and with only 16.4% renters, the tenant pool is smaller than most markets. Overseas migration adds around 72 net arrivals per year, supporting steady demand.
How is Carbrook's population changing?
Population grew 13% over the decade and is rising at 0.83% per year, adding about 79 people annually. The main driver is overseas migration at 72 net arrivals per year. Medium forecasts project growth from 9,471 in 2025 to around 9,999 by 2031, with the suburb aging: the senior share rose 7.4 points over 10 years.
How much development is happening in Carbrook?
There were 42 development applications lodged in the past 12 months, covering residential additions, sheds, decks and some commercial demolition works. This level of activity indicates ongoing reinvestment in existing properties rather than major new supply, consistent with an established, low-density suburb at 0.83% annual population growth.
How to read these comparisons
Phrases like "above the national average" reference the unweighted median across Australian suburbs with more than 1,000 residents, not population-weighted national figures. Suburb-level medians are more useful for ranking suburbs against each other; ABS census headlines are population-weighted (so dominated by Sydney and Melbourne) and can read very differently.
Current baseline (refreshed 2026-05-10): median age 40, university-educated 30.1%, born overseas 21.6%, average household size 2.5 people.
Data sources: ABS 2021 Census (demographics, income, tenure), state Valuer-General (house prices), Department of Jobs SALM (unemployment), ACARA (school ICSEA), state Crime Statistics agencies (offences), council DA portals (development applications). Population forecasts use a Hamilton-Perry cohort model calibrated to ABS ERP.
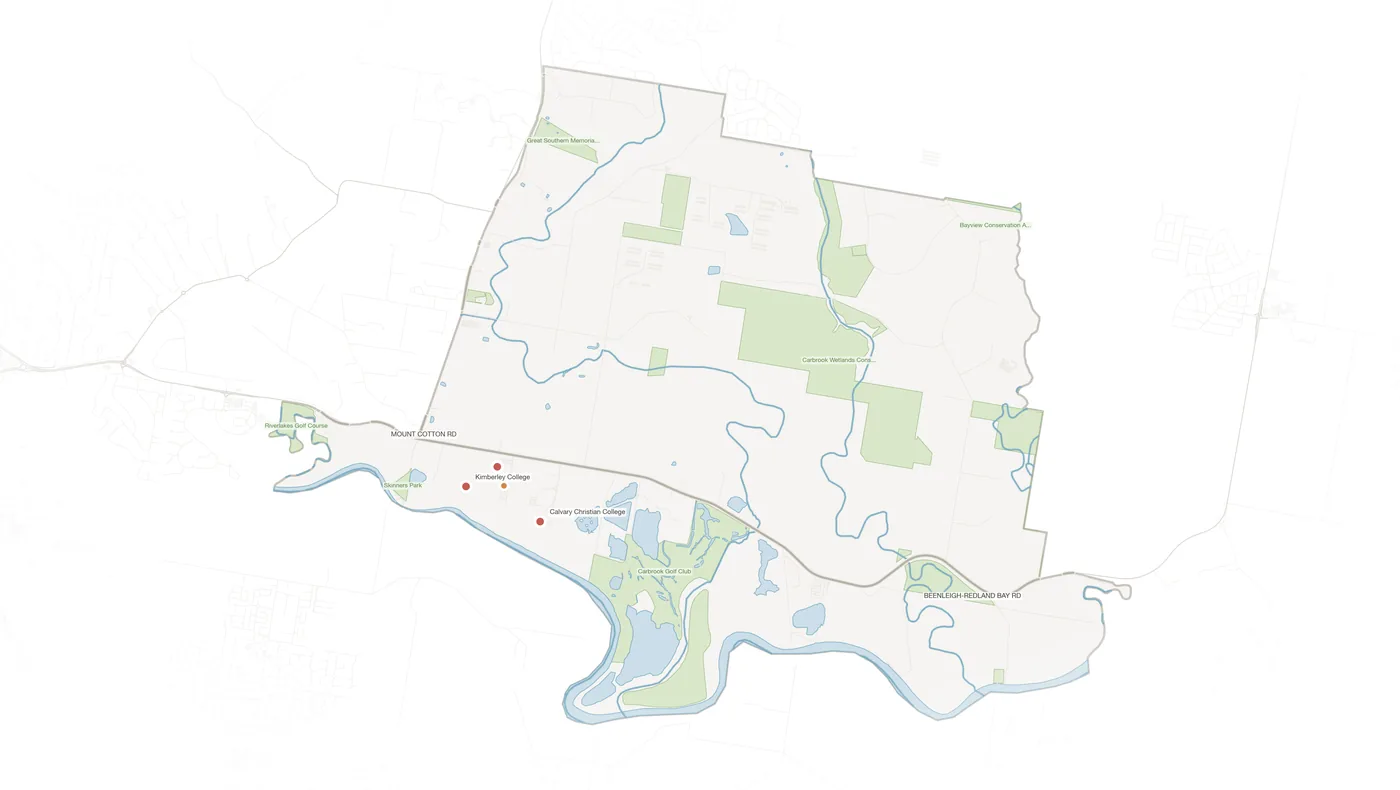
Explore Carbrook on the Map
View parcels, zoning overlays, DA applications, schools and more.
Open Interactive Map