Galiwinku
With 63.3% of workers commuting on foot or by bicycle, Galiwinku records one of the highest active-transport rates of any suburb in Australia, a direct reflection of its compact 4.85 km2 footprint and community-based structure. The median age of 25 sits 15 years below the national figure, making this one of the youngest residential populations in the Northern Territory. The household income ranks at the 71.4th percentile nationally, yet unemployment reaches 35.1%, far above the national average, because most formal employment is concentrated in service-delivery roles in Education (29.7%) and Healthcare (26.2%). All 2,199 residents rent, with 98.7% living in separate houses and average household sizes of 5.6 persons, well above the national average of 2.5.
Population
2,199
Median Age
25.0
Household IncomeiMedian weekly household income (ABS Census)
$1,913/wk
DAs (12 months)iDevelopment Applications lodged in the past year
0
Median House
$227K
Estimated from rent (2025)
Galiwinku is entirely a renter community, with 100% of occupied dwellings held under rental tenure, so conventional homebuyer metrics apply differently here. The estimated median house price of $227,000, derived from rent data in 2025, is significantly lower than the national median, and the implied monthly mortgage of $997 produces a mortgage-to-income ratio of 12.0%, below the 30% stress threshold. Separate houses account for 98.7% of dwellings, with the most common configurations being 3-bedroom homes at 37.6% and 4-plus bedroom at 31.0%, reflecting the large average household size of 5.6 persons. The absence of apartment or semi-detached stock means buyers would be entering a market dominated by standalone houses on a remote island community.
For Buyers
Galiwinku is entirely a renter community, with 100% of occupied dwellings held under rental tenure, so conventional homebuyer metrics apply differently here. The estimated median house price of $227,000, derived from rent data in 2025, is significantly lower than the national median, and the implied monthly mortgage of $997 produces a mortgage-to-income ratio of 12.0%, below the 30% stress threshold. Separate houses account for 98.7% of dwellings, with the most common configurations being 3-bedroom homes at 37.6% and 4-plus bedroom at 31.0%, reflecting the large average household size of 5.6 persons. The absence of apartment or semi-detached stock means buyers would be entering a market dominated by standalone houses on a remote island community.
For Investors
Rental demand in Galiwinku is structural rather than market-driven: 100% of dwellings are rented, and 91.7% of residents remained at the same address in the year before Census, indicating very low turnover compared to most urban markets. Weekly rent of $200 is below the national average, producing a gross yield that depends heavily on the $227,000 estimated median, suggesting returns in the range typical of regional NT markets. The 9.8% vacancy rate is elevated and warrants caution, as it is higher than the national average and reflects the remote-community context. Development activity was zero in the past 12 months, so supply pressure is absent, but demand dynamics are driven by government service provision rather than private-market forces.
Schools in Galiwinku iICSEA: school advantage index. 1000 = national avg, higher = more advantaged
Shepherdson College
T-12 · 458 students
Gawa Christian School
T-10 · 53 students
Demographics
The median age of 25 is 15 years below the national figure, placing Galiwinku among Australia's youngest communities. Only 1.9% of residents were born overseas, which is 19.7 percentage points below the national rate, reflecting an Indigenous-majority population rather than migrant settlement. Aboriginal and Torres Strait Islander languages are spoken by 979 residents, the most commonly reported language group in the suburb. University qualifications stand at 12.2%, some 17.9 percentage points below the national average, while 0.0% completed Year 12 in the recorded dataset, indicating most formal education occurs through vocational or community pathways. Average household size of 5.6 is 3.1 above the national figure, consistent with extended-family living arrangements common in remote First Nations communities.
Age Distribution
Bedrooms
Dwelling Structure
98.7%
Houses
N/A
Townhouse
N/A
Apartment
Tenure
Every occupied dwelling in Galiwinku is rented, making this one of the few suburbs in Australia with a 100% rental rate. Separate houses dominate at 98.7% of stock, reflecting the community's low-density layout across 4.85 km2. The bedroom profile skews toward larger homes: 37.6% have 3 bedrooms and 31.0% have 4 or more, consistent with average household sizes of 5.6 persons. The estimated median house price of $227,000 is well below state and national medians, and weekly rent of $200 gives a rent-to-income ratio of just 10.5%, meaning housing costs are not a stress factor relative to income. The 9.8% vacancy rate is above average for remote NT communities and suggests periodic fluctuation in occupancy.
Mortgage / mo
$997
Rent / wk
$200
HH Size
5.6
Personal Income / wk
$352
Vacancy Ratei% of dwellings unoccupied on Census night (ABS 2021)
9.8%
Unoccupied
34
Rent / IncomeiMedian rent as % of household income. Over 30% = housing stress
10.5%
Mortgage / IncomeiMedian mortgage as % of household income. Over 30% = housing stress
12.0%
Community Profile
Languages Spoken at Home
Ancestry
Household Composition
7.0%
Couples, no children
2,026
Total families
Economy & Employment
Education and Healthcare together account for 56% of all local employment, with Education at 29.7% (60 workers) and Healthcare at 26.2% (53 workers), followed by Public Administration at 11.9%. This profile is typical of a government-serviced remote community where employment depends on publicly funded institutions rather than private enterprise. The unemployment rate of 35.1% is far above the national average, and the participation rate of just 35.2% indicates that most working-age residents are not actively in the formal labour market. Professionals (108) and Community/Personal service workers (95) are the largest occupation groups, consistent with the service-delivery employment base. Full-time employment among those who do work runs at 68.3%, comparable to national norms.
Socio-Economic Indexes (SEIFA)iABS index ranking suburbs from 1 (most disadvantaged) to 10 (most advantaged)
Full-time
68.3%
Part-time
-3.4%
Participation
35.2%
Employed
369
Occupations
Top Industries
University
12.2%
Postgraduate
4.1%
Born Overseas
1.9%
Dwellings
311
Transport to Work
The suburb's most striking liveability feature is its transport pattern: 63.3% of workers commute on foot or bicycle, compared to a national car-driver rate of over 50%, because services and workplaces are accessible within the compact footprint. Only 18.9% drive to work and just 1.7% use public transport, which is lower than the national average. Housing cost stress is low, with rent-to-income at 10.5% and mortgage-to-income at 12.0%, both well below the 30% stress threshold. About 5.1% of residents, or 104 people, require daily assistance, which is below the national average. No schools are recorded inside the suburb boundary in this dataset, and no formal crime statistics are available, so families assess schooling and safety through community and Territory government sources.
Drive
18.9%
Public Transport
1.7%
Walk / Cycle
63.3%
Work from Home
N/A
National Ranking iPercentile rank among ~15,000 AU suburbs. 90% = higher than 90% of suburbs
How Galiwinku compares to ~15,000 Australian suburbs
Frequently Asked Questions
Is Galiwinku a good suburb to live in?
Galiwinku functions as a close-knit remote community with a population of 2,199, a median age of 25, and housing costs well below national levels, with rent-to-income at just 10.5%. Active transport rates of 63.3% walking or cycling reflect a walkable, community-scale environment. Trade-offs include a 35.1% unemployment rate and no schools recorded in the local dataset.
What is the median house price in Galiwinku?
The estimated median house price is $227,000, derived from rental data in 2025, which is well below the national median. Weekly rent averages $200 and the implied monthly mortgage is $997, giving a mortgage-to-income ratio of 12.0%, below the 30% stress threshold.
What schools are in Galiwinku?
No schools are recorded inside the Galiwinku boundary in this dataset. Families in remote NT communities typically access schooling through community schools administered by the Northern Territory Department of Education. University qualifications are held by 12.2% of residents, which is 17.9 percentage points below the national average.
Is Galiwinku safe?
Formal crime statistics are not available for Galiwinku in this dataset. As a contextual indicator, housing cost stress is low at 10.5% rent-to-income and 5.1% of residents (104 people) require daily assistance, below the national average. Community stability is high, with 91.7% of residents remaining at the same address over the Census year.
Is Galiwinku good for property investment?
Investment in Galiwinku carries a remote-community risk profile. Rental tenure is 100% of dwellings and weekly rent of $200 against an estimated $227,000 median suggests a gross yield near 4.6%. However, the 9.8% vacancy rate is elevated, development activity was zero in the past 12 months, and demand is driven by government service staffing rather than private markets.
How is Galiwinku's population changing?
The population of 2,199 is supported by a young demographic base with a median age of 25, which is 15 years below the national average, indicating above-average natural growth potential. Community stability is high, with 91.7% of residents remaining at the same address. No development applications were lodged in the past 12 months, so built supply is not expanding.
How to read these comparisons
Phrases like "above the national average" reference the unweighted median across Australian suburbs with more than 1,000 residents, not population-weighted national figures. Suburb-level medians are more useful for ranking suburbs against each other; ABS census headlines are population-weighted (so dominated by Sydney and Melbourne) and can read very differently.
Current baseline (refreshed 2026-05-10): median age 40, university-educated 30.1%, born overseas 21.6%, average household size 2.5 people.
Data sources: ABS 2021 Census (demographics, income, tenure), state Valuer-General (house prices), Department of Jobs SALM (unemployment), ACARA (school ICSEA), state Crime Statistics agencies (offences), council DA portals (development applications). Population forecasts use a Hamilton-Perry cohort model calibrated to ABS ERP.
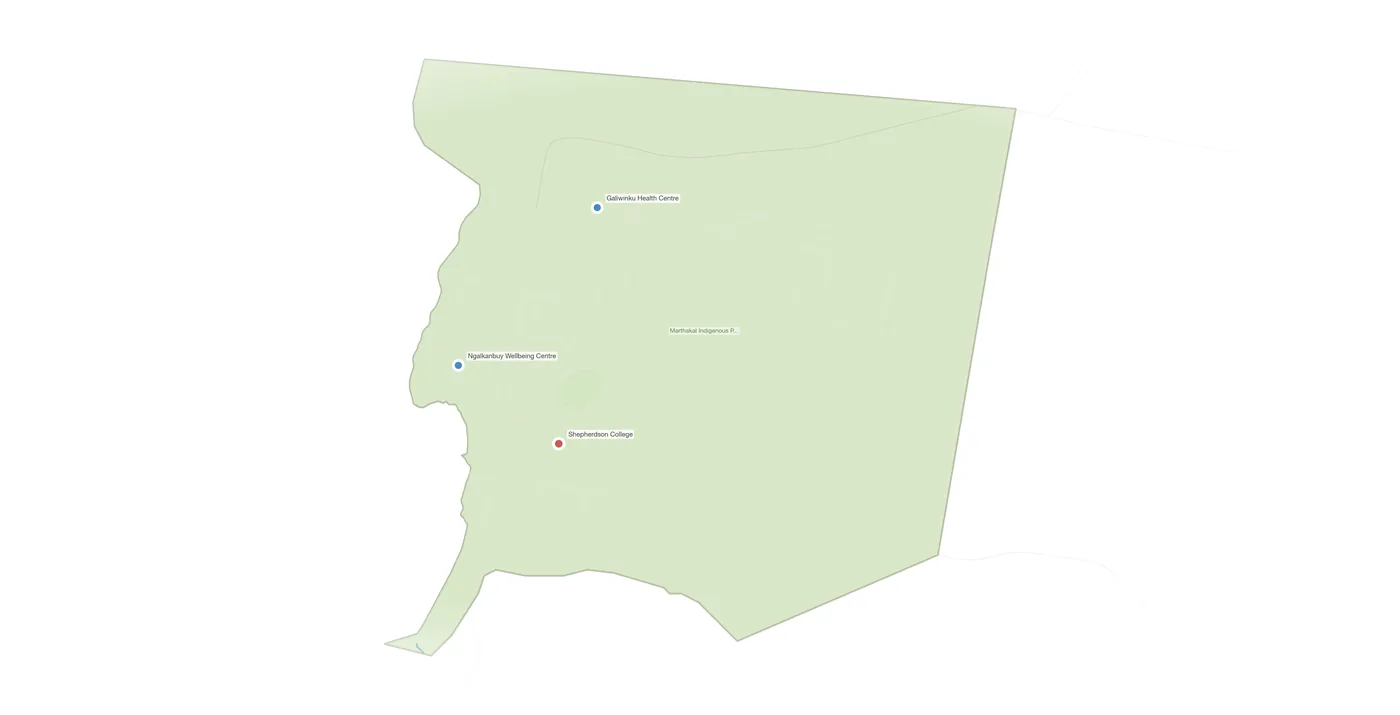
Explore Galiwinku on the Map
View parcels, zoning overlays, DA applications, schools and more.
Open Interactive Map