Jensen
Household income in Jensen sits at the 87.9th percentile nationally, yet house prices remain well below the national average at an estimated $482,000 median, making this one of the more affordable high-income pockets in Queensland. With 96.4% of dwellings being separate houses and 65.8% of households carrying a mortgage, Jensen reads as a classic owner-occupier suburb built around large family homes rather than rental yield. The 1,797-resident population grew 24% over the decade, driven primarily by internal migration averaging 72 people per year.
Population
1,797
Median Age
36.0
Household IncomeiMedian weekly household income (ABS Census)
$2,295/wk
DAs (12 months)iDevelopment Applications lodged in the past year
3
Median House
$482K
Estimated from rent (2025)
The estimated median house price of $482,000 sits below most southeast Queensland benchmarks, giving mortgage-belt buyers meaningful purchasing power. Monthly mortgage repayments average $1,907 and the mortgage-to-income ratio of 19.2% is comfortably below the 30% stress threshold, lower than many comparable Queensland suburbs. The stock is almost entirely detached houses at 96.4%, with 58.1% of dwellings having 4 or more bedrooms, which suits large families. Outright ownership at 27.4% is lower than the national average, reflecting a relatively recent settlement pattern where most residents at 65.8% are still servicing a mortgage. Rent-to-income at 15.5% also shows no financial stress for the small renter base.
For Buyers
The estimated median house price of $482,000 sits below most southeast Queensland benchmarks, giving mortgage-belt buyers meaningful purchasing power. Monthly mortgage repayments average $1,907 and the mortgage-to-income ratio of 19.2% is comfortably below the 30% stress threshold, lower than many comparable Queensland suburbs. The stock is almost entirely detached houses at 96.4%, with 58.1% of dwellings having 4 or more bedrooms, which suits large families. Outright ownership at 27.4% is lower than the national average, reflecting a relatively recent settlement pattern where most residents at 65.8% are still servicing a mortgage. Rent-to-income at 15.5% also shows no financial stress for the small renter base.
For Investors
Jensen's investor case is constrained by thin rental demand. Only 6.8% of dwellings are rented, well below state and national averages, meaning the suburb functions primarily as an owner-occupier market rather than a tenant market. Weekly rent of $355 against a $482,000 median implies a gross yield near 3.8%, modest but not unreasonable for regional Queensland. The 6.0% vacancy rate is elevated compared to healthy rental market benchmarks around 2-3%, signalling limited rental competition. Development activity is low at 3 applications in 12 months. However, population growth of 1.83% annually, driven by net internal migration of 72 per year, supports steady long-term demand.
Development Activity
Total DAs
3
Last 12 Months
3
YoY ChangeiYear-over-year change in DA lodgements
—
Avg DA CostiAverage estimated cost per DA in the past year
N/A
Monthly DA Lodgements
DA Categories
Demographics
At a median age of 36, Jensen is 4 years younger than the national median, which aligns with a household profile dominated by couples with children, who account for 764 of 1,557 total families. Average household size of 3.0 is 0.5 above the national figure, consistent with larger family dwellings. University qualifications reach only 17.2%, which is 12.9 percentage points below the national rate, suggesting the local workforce is concentrated in trades and operational roles rather than professional services. Ancestry is strongly Anglo-Celtic, led by English (773), Irish (218) and Scottish (173). The overseas-born share of 10.3% is 11.3 percentage points below the national average.
Age Distribution
Bedrooms
Dwelling Structure
96.4%
Houses
N/A
Townhouse
3.6%
Apartment
Tenure
Jensen's housing market is almost entirely detached houses at 96.4%, with apartments making up only 3.6% of stock. This detached-dominant character reflects a greenfield suburban form typical of outer Townsville. Bedrooms skew large: 58.1% of homes have 4 or more bedrooms and 36.2% have 3 bedrooms, leaving just 5.7% with 2 or fewer. Tenure splits toward mortgage holders at 65.8%, considerably higher than the national share, with outright ownership at 27.4% and renting at just 6.8%. The estimated median house price of $482,000 is derived from rent data, and with weekly rent at $355 the implied gross yield sits around 3.8%. Mortgage-to-income at 19.2% remains well within comfortable territory.
Mortgage / mo
$1,907
Rent / wk
$355
HH Size
3.0
Personal Income / wk
$950
Vacancy Ratei% of dwellings unoccupied on Census night (ABS 2021)
6.0%
Unoccupied
36
Rent / IncomeiMedian rent as % of household income. Over 30% = housing stress
15.5%
Mortgage / IncomeiMedian mortgage as % of household income. Over 30% = housing stress
19.2%
Community Profile
Ancestry
Household Composition
26.5%
Couples, no children
1,557
Total families
Economy & Employment
Healthcare (18.0%) and Construction (17.9%) together account for more than a third of local employment, reflecting Jensen's role as a working suburb in the broader Townsville regional economy. Education follows at 12.0% and Public Administration at 9.0%, which together with healthcare suggests a significant public-sector workforce. The full-time employment rate of 70.4% is solid and unemployment at 2.9% is low. By occupation, Professionals (134) and Clerical/Admin (116) lead, followed closely by Community/Personal (113) and Machinery/Drivers (102). SEIFA IRSAD decile is 3, placing Jensen in the lower 30% nationally on the combined advantage-disadvantage index, reflecting the below-average university qualification rate and lower professional concentration compared to capital-city benchmarks.
Unemployment
4.9%
Labour Force
3,334
Unemployed
163
Quarterly Trend
Source: SALM Dec-25
Socio-Economic Indexes (SEIFA)iABS index ranking suburbs from 1 (most disadvantaged) to 10 (most advantaged)
Full-time
70.4%
Part-time
26.7%
Participation
64.2%
Employed
852
Occupations
Top Industries
University
17.2%
Postgraduate
1.7%
Born Overseas
10.3%
Dwellings
563
Transport to Work
Car dependence is very high, with 91.8% of residents driving to work, compared to the national figure of around 60-65%, and only 1.3% using public transport. This reflects the suburban form and distance from Townsville's commercial centre. The IRSAD decile of 3 places Jensen below the national median on the combined advantage-disadvantage index, though mortgage and rent stress are both absent at 19.2% and 15.5% respectively. Volunteering participation at 12.7% and only 5.3% of residents needing daily assistance suggest a reasonably self-sufficient community. No schools are recorded within the suburb boundary in this dataset, so families rely on facilities in adjacent suburbs. The 14.93 sq km area at a density of 120 residents per sq km is low, reflecting a spacious outer-suburban layout.
Drive
91.8%
Public Transport
1.3%
Walk / Cycle
2.0%
Work from Home
N/A
Population Forecast
+1.83%/yr
(+124 people/yr)
EstablishedJensen's population has grown from approximately 5,470 in 2011 to around 6,770 in 2025, a 24% increase over the decade. Annual growth currently runs at 1.83%, adding roughly 124 residents per year. Internal migration is the primary driver at an average of 72 net arrivals annually, supplemented by overseas migration of 18 per year. Medium forecasts project the broader SA2 population reaching around 7,508 by 2031. The gentrification score of 21 indicates early signs of change, with population growth of 35% since 2011 and sustained internal migration inflows. Affordability improved from 46.4% of income in 2011 to 36.5% in 2021, a meaningful 9.9 percentage point improvement that reflects real income growth of 6.7% over the period.
Historical + Forecast
Hamilton-Perry + Holt smoothing on ERP 2001-2025
Age Cohort Forecast
Primary Driver
Internal Migration
Net Overseas / yr
+18
Net Internal / yr
+72
Gentrification Signal
Early signs
Population +35% since 2011, Net internal migration +72/yr
National Ranking iPercentile rank among ~15,000 AU suburbs. 90% = higher than 90% of suburbs
How Jensen compares to ~15,000 Australian suburbs
Frequently Asked Questions
Is Jensen a good suburb to live in?
Jensen suits families seeking affordable detached housing with low financial stress. The mortgage-to-income ratio of 19.2% is well below the 30% stress threshold and household income sits at the 87.9th percentile nationally. The main trade-off is high car dependence at 91.8% and a SEIFA IRSAD decile of 3, placing it in the lower 30% nationally for combined advantage.
What is the median house price in Jensen?
The estimated median house price is $482,000, based on 2025 rent data. Weekly rent averages $355 and monthly mortgage repayments run around $1,907. At these prices, the mortgage-to-income ratio is 19.2%, comfortably below the 30% financial stress threshold.
What schools are in Jensen?
No schools are recorded inside the Jensen suburb boundary in this dataset. Families rely on schools in neighbouring suburbs within the Townsville region. The local university qualification rate is 17.2%, which is 12.9 percentage points below the national figure of around 30%.
Is Jensen safe?
Crime statistics are not available for Jensen in this dataset. As an indirect indicator, the suburb has low unemployment at 2.9% and mortgage-to-income at 19.2%, both of which correlate with lower financial stress. The SEIFA IRSD decile of 3 places it in the lower 30% nationally for relative disadvantage, suggesting some socioeconomic risk factors exist compared to higher-decile suburbs.
Is Jensen good for property investment?
Jensen's owner-occupier character makes it a modest rental market. Only 6.8% of dwellings are rented and the vacancy rate is 6.0%, above the healthy 2-3% benchmark, indicating limited rental competition. Weekly rent of $355 against a $482,000 median implies around 3.8% gross yield. Population growth of 1.83% annually and net internal migration of 72 per year support long-term demand.
How is Jensen's population changing?
Jensen's population grew 24% over the decade to approximately 1,797 residents. Annual growth is 1.83%, adding around 124 people per year. Internal migration at 72 net arrivals annually is the primary driver. Medium forecasts project continued growth toward 7,508 in the broader SA2 by 2031, with an aging trajectory as the senior share rose 4.3 points over the decade.
How to read these comparisons
Phrases like "above the national average" reference the unweighted median across Australian suburbs with more than 1,000 residents, not population-weighted national figures. Suburb-level medians are more useful for ranking suburbs against each other; ABS census headlines are population-weighted (so dominated by Sydney and Melbourne) and can read very differently.
Current baseline (refreshed 2026-05-10): median age 40, university-educated 30.1%, born overseas 21.6%, average household size 2.5 people.
Data sources: ABS 2021 Census (demographics, income, tenure), state Valuer-General (house prices), Department of Jobs SALM (unemployment), ACARA (school ICSEA), state Crime Statistics agencies (offences), council DA portals (development applications). Population forecasts use a Hamilton-Perry cohort model calibrated to ABS ERP.
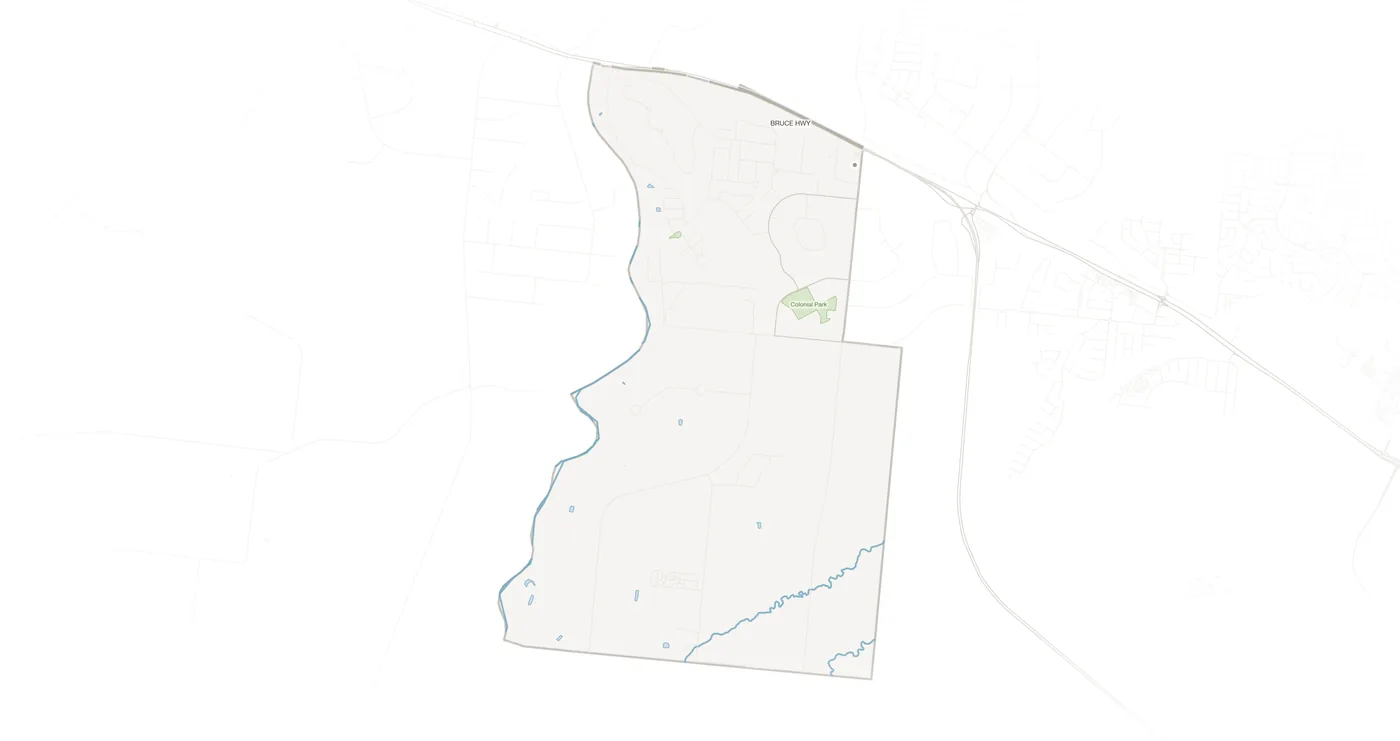
Explore Jensen on the Map
View parcels, zoning overlays, DA applications, schools and more.
Open Interactive Map