Newstead
With 99.5% apartments and a density of 10,603 people per square kilometre, Newstead functions as one of Brisbane's most concentrated residential precincts. The median age of 33 sits 7 years below the national figure, yet household income lands in the 89th percentile nationally. University attainment at 57% runs 27 percentage points above the national average, reflecting a workforce dominated by professionals (44%) and managers (21%). The 71.3% renting rate, triple the national average, signals a suburb built for career-stage mobility rather than long-term settlement.
Population
7,496
Median Age
33.0
Household IncomeiMedian weekly household income (ABS Census)
$2,325/wk
DAs (12 months)iDevelopment Applications lodged in the past year
38
Median House
$593K
Estimated from rent (2025)
Purchasing in Newstead means buying into a near-exclusively apartment market, with 99.5% of dwellings classified as flats. The estimated median of $593,000 sits well below Brisbane's inner-city house equivalents, though the comparison is misleading because detached houses represent just 0.2% of stock. Two-bedroom units dominate at 57.6% of dwellings, with one-bedroom or studio configurations accounting for 28.4%. Mortgage stress is minimal at 19.9% of income, lower than the national threshold, largely because high household incomes ($2,325/week) absorb repayments comfortably compared to outer-ring mortgage-belt suburbs.
For Buyers
Purchasing in Newstead means buying into a near-exclusively apartment market, with 99.5% of dwellings classified as flats. The estimated median of $593,000 sits well below Brisbane's inner-city house equivalents, though the comparison is misleading because detached houses represent just 0.2% of stock. Two-bedroom units dominate at 57.6% of dwellings, with one-bedroom or studio configurations accounting for 28.4%. Mortgage stress is minimal at 19.9% of income, lower than the national threshold, largely because high household incomes ($2,325/week) absorb repayments comfortably compared to outer-ring mortgage-belt suburbs.
For Investors
Rental demand is structurally embedded: 71.3% of Newstead residents rent, more than double the national rate. Weekly rent of $490 delivers solid yields against the estimated $593,000 median, but vacancy at 11.9% runs far above the Brisbane average and represents genuine leasing risk. Development activity remains active with 35 applications in 12 months, mostly commercial and mixed-use MCU proposals rather than purely residential. Net overseas migration of 43 persons per year sustains tenant inflow, though net internal outflow of 48 annually suggests residents are cycling out faster than new domestic arrivals replace them.
Development Activity
Total DAs
176
Last 12 Months
38
YoY ChangeiYear-over-year change in DA lodgements
+40.7%
Avg DA CostiAverage estimated cost per DA in the past year
N/A
Monthly DA Lodgements
DA Categories
Demographics
Newstead skews young and highly educated, with a median age of 33 compared to 40 nationally. The 57% university attainment rate ranks 27 percentage points above the national average. Overseas-born residents make up 35%, with English (2,847), Irish (1,046), and Scottish (804) ancestries leading. Mandarin (93 speakers) is the top non-English language, though linguistic diversity is modest. Average household size of 1.7, a full 0.8 persons below the national average, reflects the couples-without-children majority (69.5% of families), confirming this as a pre-family or post-family neighbourhood.
Age Distribution
Bedrooms
Dwelling Structure
0.2%
Houses
0.3%
Townhouse
99.5%
Apartment
Tenure
The housing profile is almost entirely vertical: 99.5% apartments, 0.3% semi-detached, 0.2% separate houses. Two-bedroom units command 57.6% of stock, one-bedroom or studios 28.4%, and three-bedroom units just 12.8%. Only 13.3% own outright and 15.4% carry a mortgage, while 71.3% rent. The ownership rate sits well below the national median, a structural feature of high-density inner-city precincts rather than an affordability signal. Mortgage-to-income ratio of 19.9% is below the 30% stress threshold, ranking more comfortably than most Brisbane suburbs.
Mortgage / mo
$2,000
Rent / wk
$490
HH Size
1.7
Personal Income / wk
$1,536
Vacancy Ratei% of dwellings unoccupied on Census night (ABS 2021)
11.9%
Unoccupied
529
Rent / IncomeiMedian rent as % of household income. Over 30% = housing stress
21.1%
Mortgage / IncomeiMedian mortgage as % of household income. Over 30% = housing stress
19.9%
Community Profile
Languages Spoken at Home
Ancestry
Household Composition
69.5%
Couples, no children
4,054
Total families
Economy & Employment
Professional and technical services employ 21.6% of the workforce, followed by healthcare (15.3%), public administration (7.1%), finance (7.0%), and hospitality (6.0%). Professionals and managers together account for 65% of employed residents, ranking Newstead among Brisbane's most white-collar suburbs. Unemployment at 3.0% sits below the national rate, while full-time employment at 80.1% is notably higher than the national average. The SEIFA education and occupation decile of 10 (top nationally) aligns with this profile, though the economic resources decile of 3 creates an unusual split that reflects the high-rent, low-asset nature of a transient apartment population.
Unemployment
2.0%
Labour Force
2,780
Unemployed
56
Quarterly Trend
Source: SALM Dec-25
Socio-Economic Indexes (SEIFA)iABS index ranking suburbs from 1 (most disadvantaged) to 10 (most advantaged)
Full-time
80.1%
Part-time
16.9%
Participation
71.6%
Employed
4,967
Occupations
Top Industries
University
57.0%
Postgraduate
13.5%
Born Overseas
35.0%
Dwellings
3,895
Transport to Work
Walking and cycling account for 24.8% of commutes, far higher than Brisbane's average, reflecting Newstead's proximity to the CBD and riverfront paths. Public transport captures 15.3%, and 54.4% drive, lower than most Queensland suburbs. No schools sit within the suburb boundary, which limits family appeal compared to neighbouring Teneriffe or Fortitude Valley. SEIFA disadvantage decile of 10 (least disadvantaged) and education/occupation decile of 10 confirm strong socioeconomic standing, though the economic resources decile of 3 highlights that wealth here is income-driven, not asset-driven, a pattern typical of high-rent professional enclaves.
Drive
54.4%
Public Transport
15.3%
Walk / Cycle
24.8%
Work from Home
N/A
Population Forecast
+0.46%/yr
(+25 people/yr)
EstablishedPopulation growth trends at 0.46% per year, adding roughly 25 persons annually. The SA2 population declined from 5,558 in 2023 to 5,476 in 2025, though medium projections forecast recovery to 5,735 by 2031. Net internal migration runs negative at 48 departures per year, partially offset by 43 overseas arrivals. The gentrification score of 37 shows early signs, while the young share has declined 3.1 percentage points over the decade. Affordability has remained stable, with mortgage-to-income ratios holding around 40% across both 2011 and 2021 compared to outer suburbs where ratios have climbed.
Historical + Forecast
Hamilton-Perry + Holt smoothing on ERP 2001-2025
Age Cohort Forecast
Primary Driver
Overseas Migration
Net Overseas / yr
+43
Net Internal / yr
-48
Gentrification Signal
Not gentrifying
National Ranking iPercentile rank among ~15,000 AU suburbs. 90% = higher than 90% of suburbs
How Newstead compares to ~15,000 Australian suburbs
Frequently Asked Questions
Is Newstead a good suburb to live in?
Newstead suits young professionals and couples without children. Household income sits in the 89th percentile nationally, unemployment is 3.0%, and 24.8% of residents walk or cycle to work. The SEIFA disadvantage index places it in the top decile. The trade-off is a near-total absence of houses (0.2% of stock) and no schools within the suburb boundary.
What is the median house price in Newstead?
The estimated median is $593,000, derived from rent data for 2025. Because 99.5% of dwellings are apartments, this figure reflects unit values rather than detached house prices. Two-bedroom apartments dominate at 57.6% of stock.
What schools are in Newstead?
No schools are located within Newstead's boundaries. Families typically access schools in adjacent suburbs like Fortitude Valley, Teneriffe, or Bowen Hills. The absence of schools is consistent with the suburb's 69.5% couples-without-children family composition.
Is Newstead safe?
Crime data is not available for Newstead at the suburb level in the current dataset. The SEIFA index of relative socio-economic disadvantage places Newstead in decile 10 (least disadvantaged nationally), which typically correlates with lower crime rates than average.
Is Newstead good for property investment?
The 71.3% renting rate creates structural rental demand, and weekly rent of $490 supports yield. However, vacancy at 11.9% is roughly double Brisbane's average, introducing leasing risk. With 35 development applications in 12 months, new supply continues to enter the market. Investors should weigh the high demand against the elevated vacancy when comparing to tighter markets.
How is Newstead's population changing?
Population growth runs at 0.46% annually, adding about 25 people per year. The SA2 area declined from 5,558 to 5,476 between 2023 and 2025, though projections forecast 5,735 by 2031. Net internal migration is negative at 48 departures per year, partially offset by 43 overseas arrivals annually.
What languages are spoken in Newstead?
English dominates, with 35% of residents born overseas. Mandarin is the most common non-English language with 93 speakers, followed by Japanese (34), Italian (30), French (26), and Cantonese (25). Linguistic diversity is modest compared to suburbs with similar overseas-born rates.
What development is happening in Newstead?
There were 35 development applications lodged in the past 12 months. Recent applications include mixed-use commercial proposals combining food outlets, offices, and multiple dwellings. The activity profile reflects ongoing commercial densification rather than purely residential expansion, consistent with Newstead's transformation over the past decade.
How to read these comparisons
Phrases like "above the national average" reference the unweighted median across Australian suburbs with more than 1,000 residents, not population-weighted national figures. Suburb-level medians are more useful for ranking suburbs against each other; ABS census headlines are population-weighted (so dominated by Sydney and Melbourne) and can read very differently.
Current baseline (refreshed 2026-05-10): median age 40, university-educated 30.1%, born overseas 21.6%, average household size 2.5 people.
Data sources: ABS 2021 Census (demographics, income, tenure), state Valuer-General (house prices), Department of Jobs SALM (unemployment), ACARA (school ICSEA), state Crime Statistics agencies (offences), council DA portals (development applications). Population forecasts use a Hamilton-Perry cohort model calibrated to ABS ERP.
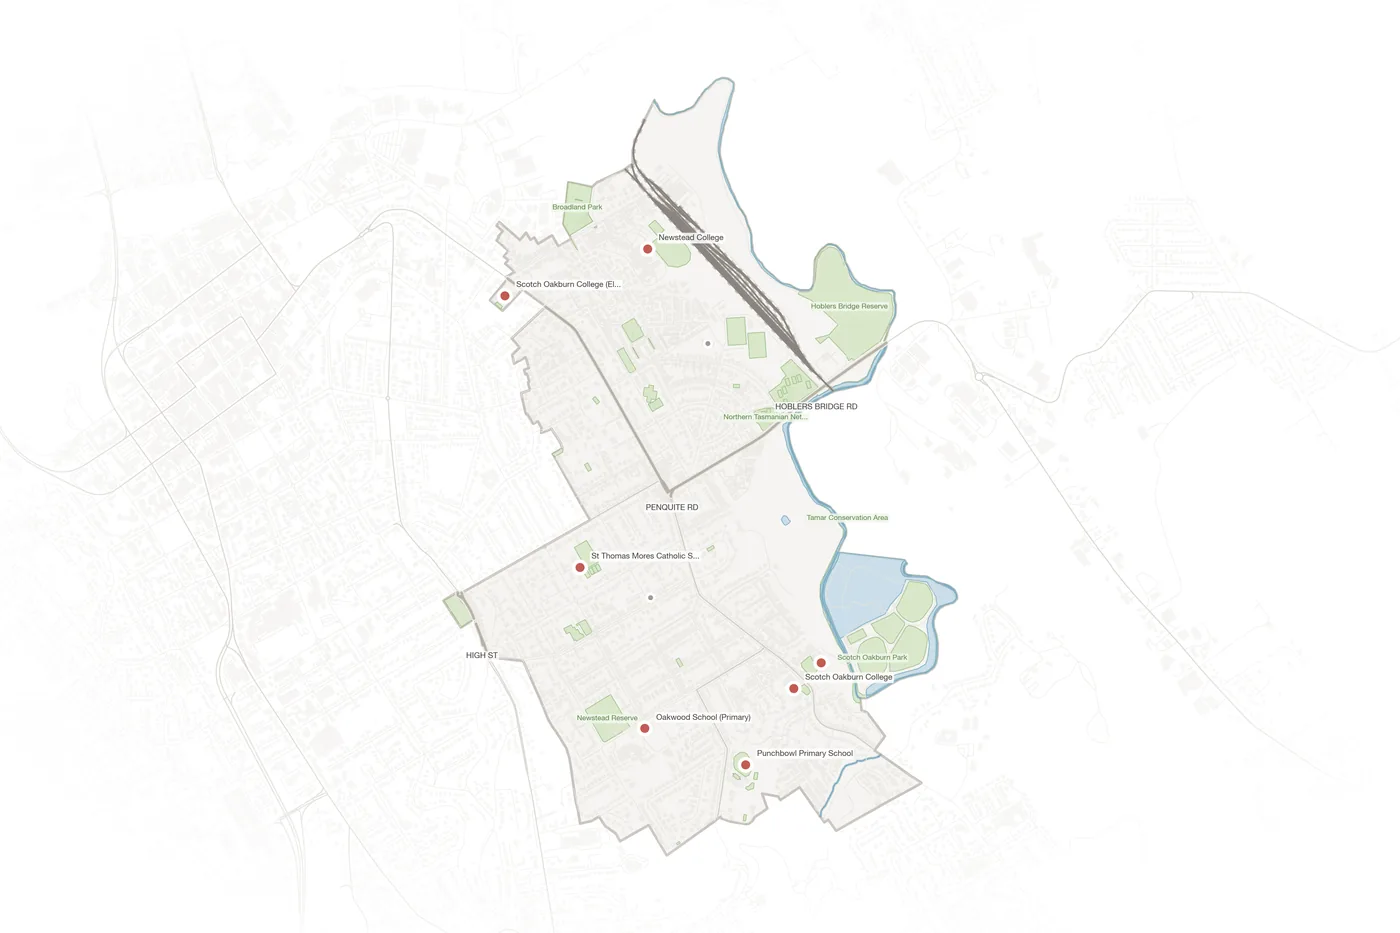
Explore Newstead on the Map
View parcels, zoning overlays, DA applications, schools and more.
Open Interactive Map