Nhulunbuy
Nhulunbuy pairs a household income at the 96th percentile nationally with a $267,000 estimated median house price, a combination that is almost nowhere else in Australia. The suburb is a remote mining and services town on the Gove Peninsula where 90.5% of residents rent, the vacancy rate sits at 18.8%, and population has fallen 17% over the prior decade. The workforce skews professional: mining (23.5%) and healthcare (22.7%) dominate employment, unemployment is just 2.5%, and full-time employment reaches 79.7%. Despite the income advantage, the town faces sustained population decline, running at roughly 21 fewer residents per year on current trend.
Population
3,350
Median Age
33.0
Household IncomeiMedian weekly household income (ABS Census)
$2,777/wk
DAs (12 months)iDevelopment Applications lodged in the past year
0
Median House
$267K
Estimated from rent (2025)
The estimated median house price of $267,000 is well below the national median, which makes entry costs low in dollar terms, but the ownership market is unusually thin. Only 5.6% of dwellings are owned outright and just 3.9% carry a mortgage, compared to far higher ownership rates in most Australian suburbs. Nearly all housing is separate houses at 85.7%, with 60.4% of dwellings having 3 bedrooms. Monthly mortgage repayments average $1,741 and the mortgage-to-income ratio is 14.5%, comfortably below stress thresholds. Buyers purchasing here are typically company or government employees tied to a specific employer, because private resale activity is limited in a town where most housing is managed by employers or housing authorities.
For Buyers
The estimated median house price of $267,000 is well below the national median, which makes entry costs low in dollar terms, but the ownership market is unusually thin. Only 5.6% of dwellings are owned outright and just 3.9% carry a mortgage, compared to far higher ownership rates in most Australian suburbs. Nearly all housing is separate houses at 85.7%, with 60.4% of dwellings having 3 bedrooms. Monthly mortgage repayments average $1,741 and the mortgage-to-income ratio is 14.5%, comfortably below stress thresholds. Buyers purchasing here are typically company or government employees tied to a specific employer, because private resale activity is limited in a town where most housing is managed by employers or housing authorities.
For Investors
A 90.5% renter share, higher than nearly any comparable suburb nationally, sounds like strong investor demand, but the weekly rent of $120 delivers a very low yield against the $267,000 median price. The 18.8% vacancy rate signals genuine oversupply relative to current population, and the population decline of 0.55% per year means demand is contracting rather than growing. Net internal migration averages negative 7 per year, partially offset by 23 overseas arrivals annually. Development activity recorded zero applications in the past 12 months, consistent with an area not attracting new private investment. The investment case depends entirely on whether a major employer anchor, such as mining or healthcare contracts, stabilises occupancy.
Schools in Nhulunbuy iICSEA: school advantage index. 1000 = national avg, higher = more advantaged
Nhulunbuy Christian College
T-10 · 138 students
Nhulunbuy Primary School
T-6 · 349 students
Nhulunbuy High School
7-12 · 279 students
Demographics
The median age of 33 is 7.0 years below the national figure, reflecting a workforce town that draws young professionals and tradespeople rather than retirees or long-term family residents. Overseas-born residents account for 18.7%, which is 2.9 points below the national average. The top ancestry is English (929 residents), followed by Irish and Scottish, and the largest non-English language group is Aboriginal and Torres Strait Islander languages. University qualifications reach 22.6%, which is 7.5 points below national, consistent with a population heavily weighted toward trades, technical and operational roles. The average household size of 2.8 is 0.3 above national. Turnover is high at 33.9% of residents having moved within five years, a normal pattern for a fly-in or contract-employment town.
Age Distribution
Bedrooms
Dwelling Structure
85.7%
Houses
7.6%
Townhouse
5.3%
Apartment
Tenure
Tenure in Nhulunbuy is almost entirely rental: 90.5% of households rent, compared to a national renter share well below half. Outright owners at 5.6% and mortgage holders at 3.9% together make up less than 10% of dwellings, among the lowest ownership rates in Australia. Stock is dominated by separate houses at 85.7%, with semi-detached at 7.6% and apartments at 5.3%. The bedroom profile skews 3-bedroom at 60.4%, with 4-plus bedrooms at 19.2%. The estimated median house price is $267,000, derived from rent data rather than a thick sale transactions market. Rent at $120 per week is very low and the rent-to-income ratio of 4.3% means tenants face minimal rental stress, well below the 30% threshold used nationally.
Mortgage / mo
$1,741
Rent / wk
$120
HH Size
2.8
Personal Income / wk
$1,465
Vacancy Ratei% of dwellings unoccupied on Census night (ABS 2021)
18.8%
Unoccupied
197
Rent / IncomeiMedian rent as % of household income. Over 30% = housing stress
4.3%
Mortgage / IncomeiMedian mortgage as % of household income. Over 30% = housing stress
14.5%
Community Profile
Languages Spoken at Home
Ancestry
Household Composition
17.6%
Couples, no children
2,083
Total families
Economy & Employment
Mining employs 23.5% of workers (267 people), making it the single largest industry, followed by healthcare at 22.7% (258 workers) and public administration at 11.8%. Education accounts for 11.1% and construction 6.2%. By occupation, Professionals lead at 377 workers, then Clerical/Admin at 207, Managers at 172, Community and Personal services at 171, and Machinery/Drivers at 142. The unemployment rate is 2.5%, well below the national average, and the full-time employment rate of 79.7% is high. Labour force participation sits at 59.9%, with 321 people not in the labour force. The IRSD decile of 9 indicates low relative disadvantage nationally, reflecting the high incomes driven by mining and government service employment in a remote location.
Unemployment
0.6%
Labour Force
3,031
Unemployed
19
Quarterly Trend
Source: SALM Dec-25
Socio-Economic Indexes (SEIFA)iABS index ranking suburbs from 1 (most disadvantaged) to 10 (most advantaged)
Full-time
79.7%
Part-time
17.8%
Participation
59.9%
Employed
1,435
Occupations
Top Industries
University
22.6%
Postgraduate
5.7%
Born Overseas
18.7%
Dwellings
842
Transport to Work
Car use dominates at 77.6% of workers driving to work, with walking and cycling at 11.1% and public transport at just 1.9%, reflecting the absence of a meaningful transit network in this remote town. The suburb scores decile 9 on IRSD nationally, indicating very low relative disadvantage, and decile 7 on IRSAD, a broader advantage index. Only 1.7% of residents (44 people) need daily assistance. The volunteering rate is 25%, above what many comparable suburbs record, suggesting strong community participation. No schools are recorded within the suburb boundary in this dataset. Rent-to-income at 4.3% means tenants are far more financially comfortable than the national average, a direct result of employer-subsidised or government-managed housing arrangements common in remote NT communities.
Drive
77.6%
Public Transport
1.9%
Walk / Cycle
11.1%
Work from Home
N/A
Population Forecast
-0.55%/yr
(-21 people/yr)
EstablishedPopulation has declined 17% over the past decade, and the current medium forecast projects continued contraction from roughly 3,606 in 2026 to around 3,508 by 2031. The annual trend loss is about 21 people per year, at a rate of negative 0.55%. Net internal migration averages negative 7 per year while overseas migration contributes 23 arrivals annually, leaving a small net positive from migration that does not offset natural contraction. The shift indicators show a declining young-resident base, with the young share down 3.1 points over the decade, and a worsening affordability trend even though prices remain low in absolute terms. The gentrification score is 15, classified as not gentrifying, appropriate for a remote resource town rather than an urban area subject to capital appreciation dynamics.
Historical + Forecast
Hamilton-Perry + Holt smoothing on ERP 2001-2025
Age Cohort Forecast
Primary Driver
Balanced
Net Overseas / yr
+23
Net Internal / yr
-7
Gentrification Signal
Not gentrifying
Accelerating: -27% → 15%
National Ranking iPercentile rank among ~15,000 AU suburbs. 90% = higher than 90% of suburbs
How Nhulunbuy compares to ~15,000 Australian suburbs
Frequently Asked Questions
Is Nhulunbuy a good suburb to live in?
Nhulunbuy suits people employed in mining, healthcare or government services. Household income sits at the 96th percentile nationally, unemployment is just 2.5%, and the IRSD decile of 9 indicates low disadvantage. The trade-off is remoteness, a 90.5% rental market, and a population that has fallen 17% over the past decade.
What is the median house price in Nhulunbuy?
The estimated median house price is $267,000, based on rent data for 2025 because sale transaction volumes are thin in this employer-dominated housing market. Weekly rent averages $120 and monthly mortgage repayments run about $1,741, giving a mortgage-to-income ratio of 14.5%, well below stress thresholds.
What schools are in Nhulunbuy?
No schools are recorded within the Nhulunbuy suburb boundary in this dataset. The town does have educational facilities serving the local population, consistent with 11.1% of employed residents working in education. University qualifications locally reach 22.6%, which is 7.5 points below the national average.
Is Nhulunbuy safe?
Detailed crime rate data is not available for Nhulunbuy in this dataset. As an indirect indicator, the suburb scores decile 9 on the IRSD index of relative disadvantage nationally, one of the higher tiers, and only 1.7% of its 3,350 residents require daily assistance. Volunteering runs at 25%, suggesting a stable community environment.
Is Nhulunbuy good for property investment?
The investment case is challenging. Weekly rent of $120 against a $267,000 median gives a low gross yield, the vacancy rate is 18.8%, and population has declined 17% over 10 years. Zero development applications in the past 12 months confirms limited private sector confidence. Returns depend on employer anchor tenants in mining or government rather than open market demand.
How is Nhulunbuy's population changing?
Population has declined 17% over the past decade and is forecast to continue falling at around 21 people per year, reaching approximately 3,508 by 2031 from a current 3,350. The young resident share has dropped 3.1 points over the decade. Net overseas migration of 23 per year partially offsets internal outflow of negative 7 per year.
How to read these comparisons
Phrases like "above the national average" reference the unweighted median across Australian suburbs with more than 1,000 residents, not population-weighted national figures. Suburb-level medians are more useful for ranking suburbs against each other; ABS census headlines are population-weighted (so dominated by Sydney and Melbourne) and can read very differently.
Current baseline (refreshed 2026-05-10): median age 40, university-educated 30.1%, born overseas 21.6%, average household size 2.5 people.
Data sources: ABS 2021 Census (demographics, income, tenure), state Valuer-General (house prices), Department of Jobs SALM (unemployment), ACARA (school ICSEA), state Crime Statistics agencies (offences), council DA portals (development applications). Population forecasts use a Hamilton-Perry cohort model calibrated to ABS ERP.
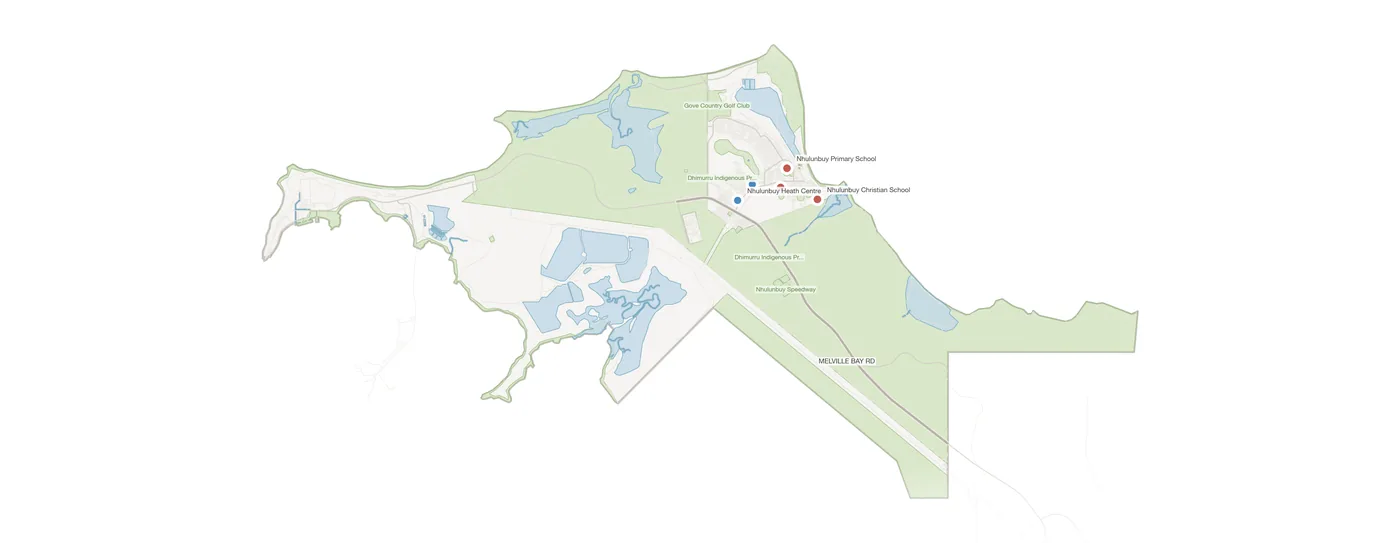
Explore Nhulunbuy on the Map
View parcels, zoning overlays, DA applications, schools and more.
Open Interactive Map