Paddington
Household incomes at the 95.9th percentile ($2,775/week) and IRSAD decile 10 place Paddington among Brisbane's wealthiest suburbs, yet only 25.5% own outright and 43.5% rent, creating a suburb where high earnings coexist with rental tenure. University qualifications at 63.4% are 33.3 points above the national average, and IEO decile 10 confirms the highest education tier nationally. Development activity is intense at 99 DAs in 12 months, the highest in this batch by a wide margin, suggesting significant renovation and infill pressure on the character housing stock. Walking/cycling at 13.5% is well above the national average, reflecting dense inner-city form with 3,682 people per km2.
Population
9,063
Median Age
34.0
Household IncomeiMedian weekly household income (ABS Census)
$2,775/wk
DAs (12 months)iDevelopment Applications lodged in the past year
102
Median House
$659K
Estimated from rent (2025)
The $659,000 estimated median is surprisingly moderate for a top-5-percentile income suburb, explained by the 21.7% apartment share pulling down the blended figure; detached character homes transact well above this. Houses at 66.2% still dominate, with semi-detached at 11.5% and apartments at 21.7%. Bedroom mix is diverse: 4+ bedrooms (33.9%), three-bedrooms (33.3%) and two-bedrooms (25.0%) each hold significant share. Monthly mortgage repayments of $2,708 produce a mortgage-to-income ratio of 22.5%, comfortably below the 30% stress threshold. Petrie Terrace State School (ICSEA 1,130, 257 students) scores well above the national benchmark. The 35.9% turnover rate is high, reflecting a transient population despite the premium address.
For Buyers
The $659,000 estimated median is surprisingly moderate for a top-5-percentile income suburb, explained by the 21.7% apartment share pulling down the blended figure; detached character homes transact well above this. Houses at 66.2% still dominate, with semi-detached at 11.5% and apartments at 21.7%. Bedroom mix is diverse: 4+ bedrooms (33.9%), three-bedrooms (33.3%) and two-bedrooms (25.0%) each hold significant share. Monthly mortgage repayments of $2,708 produce a mortgage-to-income ratio of 22.5%, comfortably below the 30% stress threshold. Petrie Terrace State School (ICSEA 1,130, 257 students) scores well above the national benchmark. The 35.9% turnover rate is high, reflecting a transient population despite the premium address.
For Investors
Renters at 43.5% provide a substantial tenant pool. Weekly rent of $470 against a $659,000 estimated median produces gross yield around 3.7%, reasonable for inner Brisbane. The 7.2% vacancy rate is elevated, suggesting some supply-demand imbalance. With 99 DAs lodged in 12 months, renovation and infill activity is intense, signalling strong confidence in future values but also potential for construction disruption. Rent growth of 15.7% over the decade is moderate. The 4.1% unemployment rate is below average, and the high-income tenant profile ($1,283/week personal income) reduces default risk. Volunteering at 20.4%, the highest in this batch, suggests strong community engagement that supports property desirability.
Development Activity
Total DAs
422
Last 12 Months
102
YoY ChangeiYear-over-year change in DA lodgements
-8.9%
Avg DA CostiAverage estimated cost per DA in the past year
N/A
Monthly DA Lodgements
DA Categories
Schools in Paddington iICSEA: school advantage index. 1000 = national avg, higher = more advantaged
Petrie Terrace State School
Prep-6 · 257 students
Demographics
The median age of 34 is 6 years below the national median. Overseas-born at 20.8% is 0.8 points below national, making Paddington one of the most Australian-born suburbs in this batch. English ancestry dominates at 3,804, followed by Irish (1,757), Scottish (1,356) and German (589), forming a strongly Anglo-Celtic profile. Non-English languages are minimal: Mandarin (43), Italian (31) and French (30) lead. University qualifications at 63.4% are 33.3 points above national, among the highest nationally. Professionals (2,418) and Managers (1,015) together comprise two-thirds of the employed workforce. Average household size of 2.5 equals the national figure. Christianity (3,629) is the dominant religion, with very small Buddhist (89) and other (46) minorities.
Age Distribution
Bedrooms
Dwelling Structure
66.2%
Houses
11.5%
Townhouse
21.7%
Apartment
Tenure
Renters at 43.5% are the largest tenure group, with mortgage holders at 31.0% and outright owners at 25.5%. The stock is 66.2% detached houses, 21.7% apartments and 11.5% semi-detached, a diverse mix reflecting the suburb's evolution from character homes to medium-density infill. The bedroom distribution is unusually even: 4+ bedrooms (33.9%), three-bedrooms (33.3%) and two-bedrooms (25.0%). Studios/one-bedrooms at 7.8% are moderate. Mortgage-to-income at 22.5% and rent-to-income at 16.9% are both well below stress thresholds, reflecting the high incomes rather than cheap housing. The IER decile 6 seems low for a top-income suburb but is pulled down by the 43.5% renter share, which reduces aggregate household wealth metrics.
Mortgage / mo
$2,708
Rent / wk
$470
HH Size
2.5
Personal Income / wk
$1,283
Vacancy Ratei% of dwellings unoccupied on Census night (ABS 2021)
7.2%
Unoccupied
273
Rent / IncomeiMedian rent as % of household income. Over 30% = housing stress
16.9%
Mortgage / IncomeiMedian mortgage as % of household income. Over 30% = housing stress
22.5%
Community Profile
Languages Spoken at Home
Ancestry
Household Composition
29.2%
Couples, no children
6,360
Total families
Economy & Employment
Professional/Tech leads at 19.9% (864 workers), nearly tied with Healthcare at 18.8% (816), together employing almost 40% of residents. Education at 10.7% (464), Public Admin at 7.1% (307) and Construction at 6.0% (260) follow. Professionals (2,418) dominate occupations, with Managers (1,015) second. Full-time employment at 67.5% is moderate, but participation at 69.2% is well above the national rate. Unemployment at 4.1% is below average. The workforce is overwhelmingly knowledge-economy oriented: Professional + Manager occupation share exceeds 65% of all employed residents. SEIFA readings are consistently high: IEO 10, IRSD 10, IRSAD 10, with only IER at 6 due to the renter wealth effect described above.
Socio-Economic Indexes (SEIFA)iABS index ranking suburbs from 1 (most disadvantaged) to 10 (most advantaged)
Full-time
67.5%
Part-time
28.4%
Participation
69.2%
Employed
5,034
Occupations
Top Industries
University
63.4%
Postgraduate
17.5%
Born Overseas
20.8%
Dwellings
3,488
Transport to Work
Walking/cycling at 13.5% is well above the national average, with public transport at 12.0% and car driving at 69.6%. Petrie Terrace State School (ICSEA 1,130, 257 students, government) is the only school, scoring well above the national 1,000 benchmark. IRSAD decile 10 and IRSD decile 10 confirm the highest socio-economic advantage tier. Rent-to-income at 16.9% is the lowest in this batch, reflecting high incomes. Only 2.3% need assistance, the lowest rate in the dataset. Volunteering at 20.4% is the highest in this batch. The 7.2% vacancy rate gives renters some choice. The key livability strength is the combination of inner-city walkability, high incomes and strong community engagement.
Drive
69.6%
Public Transport
12.0%
Walk / Cycle
13.5%
Work from Home
N/A
National Ranking iPercentile rank among ~15,000 AU suburbs. 90% = higher than 90% of suburbs
How Paddington compares to ~15,000 Australian suburbs
Frequently Asked Questions
Is Paddington a good suburb to live in?
Paddington ranks in the top 5% nationally for household income ($2,775/week) with IRSAD decile 10. Walking/cycling at 13.5% and public transport at 12.0% support car-lite living. University qualifications at 63.4% are 33.3 points above national. Petrie Terrace State School scores ICSEA 1,130. The main trade-off is a 35.9% turnover rate, indicating a transient population.
What is the median house price in Paddington?
The estimated median is $659,000 (derived from rent, 2025), pulled down by the 21.7% apartment share. Detached character homes transact above this blended figure. Weekly rent averages $470 and monthly mortgage repayments are $2,708. Gross rental yield sits around 3.7%. Mortgage-to-income at 22.5% is well below the stress threshold.
What schools are in Paddington?
Petrie Terrace State School is the sole school, a government primary with ICSEA 1,130 (well above the national 1,000 benchmark) and 257 students. The high ICSEA is consistent with the suburb's IRSAD decile 10 profile. Secondary schooling requires travel to neighbouring suburbs such as Kelvin Grove or Milton.
Is Paddington safe?
Crime data is not available for Paddington in the current dataset. The IRSD decile 10 and IRSAD decile 10 indicate the highest socio-economic advantage tier, which typically correlates with lower crime rates. Unemployment at 4.1% is below average. The 2.3% needing assistance rate is the lowest in this dataset.
Is Paddington good for property investment?
Gross yield around 3.7% ($470/week on $659,000) is reasonable for inner Brisbane. The 43.5% renter share provides a strong tenant pool, and the high-income tenant profile ($1,283/week) reduces default risk. The 7.2% vacancy rate needs monitoring. With 99 DAs in 12 months, renovation intensity signals strong property confidence. Unemployment at 4.1% is well below average.
How is Paddington's population changing?
Forecast data is limited, but the 2021 Census recorded 9,063 residents. The 35.9% turnover rate is high, suggesting young professionals cycling through. With 20.8% born overseas (0.8 points below national), the population is predominantly Australian-born. The 99 DAs in 12 months, mostly renovations, indicate physical transformation of the character housing stock without dramatic demographic change.
How to read these comparisons
Phrases like "above the national average" reference the unweighted median across Australian suburbs with more than 1,000 residents, not population-weighted national figures. Suburb-level medians are more useful for ranking suburbs against each other; ABS census headlines are population-weighted (so dominated by Sydney and Melbourne) and can read very differently.
Current baseline (refreshed 2026-05-10): median age 40, university-educated 30.1%, born overseas 21.6%, average household size 2.5 people.
Data sources: ABS 2021 Census (demographics, income, tenure), state Valuer-General (house prices), Department of Jobs SALM (unemployment), ACARA (school ICSEA), state Crime Statistics agencies (offences), council DA portals (development applications). Population forecasts use a Hamilton-Perry cohort model calibrated to ABS ERP.
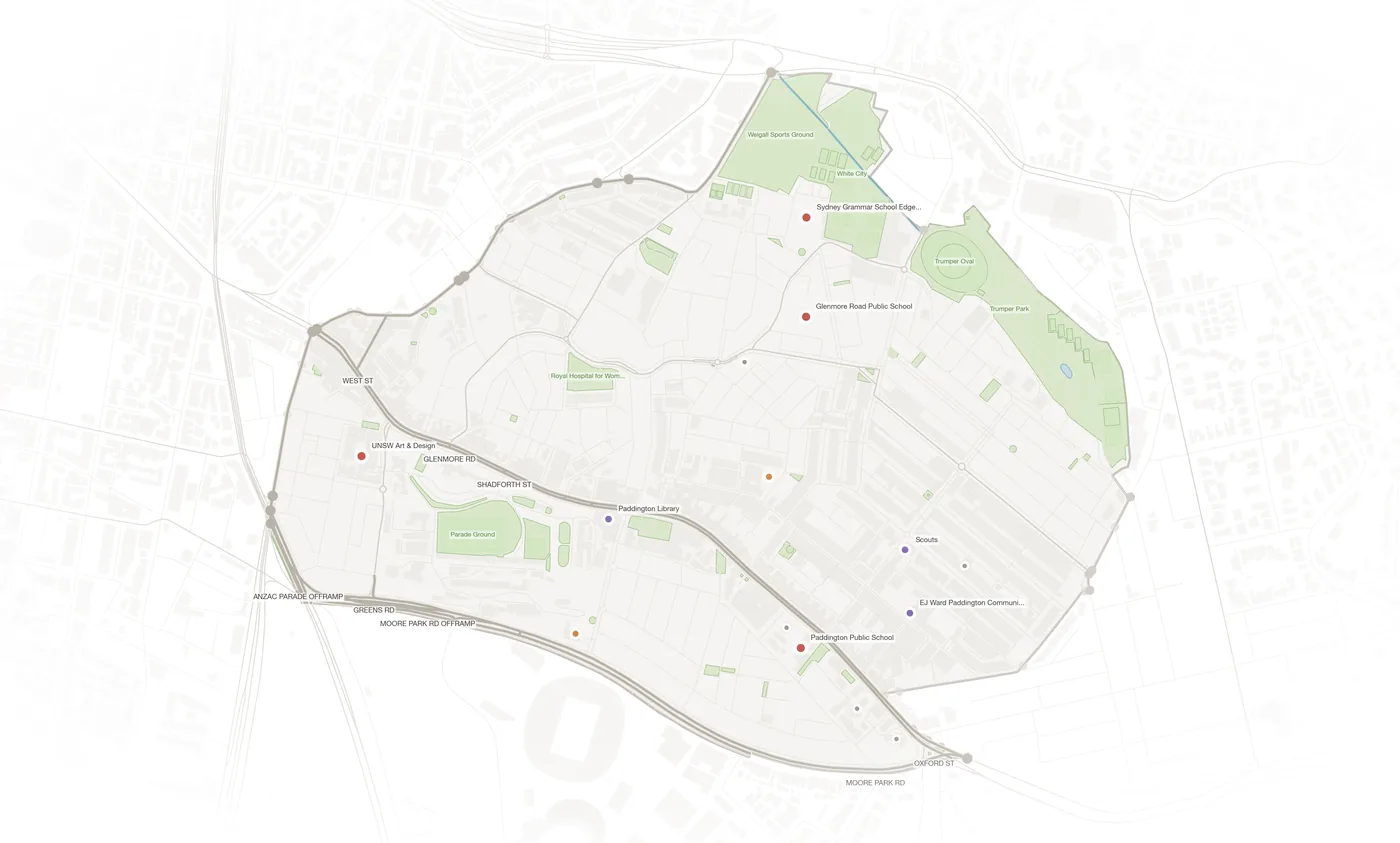
Explore Paddington on the Map
View parcels, zoning overlays, DA applications, schools and more.
Open Interactive Map