Rocky Point
With a median age of 52, Rocky Point sits 12 years above the national figure, making it one of Far North Queensland's most distinctly older-skewing localities. The 145 residents spread across 8.14 square kilometres achieve household income at the 66.1st percentile nationally, above average for a rural coastal market. Outright ownership at 47.1% is well above national norms, signalling a settled, debt-light community that has largely moved past the mortgage phase. A 19.7% vacancy rate in a market where every dwelling is a separate house points to seasonal or dual-residence use rather than structural oversupply. SEIFA scores place the suburb at decile 9 on IEO and decile 8 on both IRSAD and IRSD, putting it above the majority of Australian suburbs on education advantage and low disadvantage.
Population
145
Median Age
52.0
Household IncomeiMedian weekly household income (ABS Census)
$1,833/wk
DAs (12 months)iDevelopment Applications lodged in the past year
0
Median House
$416K
Estimated from rent (2025)
The estimated median house price of $416,000, derived from rental data for 2025, sits below most coastal Queensland benchmarks and reflects the rural character of the area. Monthly mortgage repayments average $1,365, producing a mortgage-to-income ratio of 17.2%, comfortably below the 30% stress threshold. All dwellings are separate houses, so buyers are not competing with apartment or semi-detached supply. Bedroom distribution skews large: 43.2% of homes have 3 bedrooms and 38.6% have 4 or more, with only 18.2% at 2 bedrooms. At 47.1% owned outright versus 33.3% carrying a mortgage, the ownership profile suggests many residents bought in at lower prices in earlier decades, reducing the forced-sale risk that typically weighs on higher-leverage suburbs.
For Buyers
The estimated median house price of $416,000, derived from rental data for 2025, sits below most coastal Queensland benchmarks and reflects the rural character of the area. Monthly mortgage repayments average $1,365, producing a mortgage-to-income ratio of 17.2%, comfortably below the 30% stress threshold. All dwellings are separate houses, so buyers are not competing with apartment or semi-detached supply. Bedroom distribution skews large: 43.2% of homes have 3 bedrooms and 38.6% have 4 or more, with only 18.2% at 2 bedrooms. At 47.1% owned outright versus 33.3% carrying a mortgage, the ownership profile suggests many residents bought in at lower prices in earlier decades, reducing the forced-sale risk that typically weighs on higher-leverage suburbs.
For Investors
A 19.6% renter share is thin, and the 19.7% vacancy rate means nearly 1 in 5 dwellings is empty at any time, reflecting seasonal or part-time use in a 145-person market. Weekly rent of $350 against an estimated $416,000 median implies a gross yield around 4.4%, above many southeast Queensland coastal markets. Rent-to-income sits at 19.1%, meaning tenants are not financially stressed, which supports stable tenancies. Overseas migration drives broader area growth at a net 142 persons annually, compared to a net internal outflow of 89, so demand depends on international arrivals rather than domestic relocation. Zero development applications were lodged in the past 12 months, confirming supply is not expanding and limiting dilution risk.
Schools in Rocky Point iICSEA: school advantage index. 1000 = national avg, higher = more advantaged
Western Cape College
Prep-12 · 1010 students
Demographics
The median age of 52 runs 12 years above the national average, and the aging trajectory is confirmed: the senior share rose 5.9 points over the decade while the young adult share fell 2.6 points. Couples without children account for 40.6% of families, above national norms, consistent with empty-nesters who have stayed in place. The 90.4% residential stability rate reinforces this: only 9.6% of residents moved in the 5 years prior to the Census, lower than most QLD suburbs. Overseas-born residents reach 22.0%, which is 0.4 points above the national figure. Ancestry leads with English (47 people), followed by Italian (17) and German (10). Volunteering at 21.4% exceeds typical national rates, pointing to a civic-minded older community.
Age Distribution
Bedrooms
Dwelling Structure
100.0%
Houses
N/A
Townhouse
N/A
Apartment
Tenure
Every dwelling in Rocky Point is a separate house, a uniformity rare even in rural Queensland, where the national stock mix includes roughly a third non-house dwellings. Bedroom distribution leans large: 38.6% have 4 or more bedrooms and 43.2% have 3 bedrooms, compared to a national average that sits lower on both measures. Tenure is dominated by outright owners at 47.1%, with mortgagees at 33.3% and renters at 19.6%. The estimated median of $416,000 sits below the national house median, and mortgage-to-income at 17.2% and rent-to-income at 19.1% both fall well below stress thresholds. Average household size of 2.6 is slightly above the national figure, consistent with family-sized occupancy across the larger detached stock.
Mortgage / mo
$1,365
Rent / wk
$350
HH Size
2.6
Personal Income / wk
$809
Vacancy Ratei% of dwellings unoccupied on Census night (ABS 2021)
19.7%
Unoccupied
13
Rent / IncomeiMedian rent as % of household income. Over 30% = housing stress
19.1%
Mortgage / IncomeiMedian mortgage as % of household income. Over 30% = housing stress
17.2%
Community Profile
Ancestry
Household Composition
40.6%
Couples, no children
106
Total families
Economy & Employment
Construction and Hospitality each account for 20% of local employment, followed by Public Administration, Education and Healthcare at 16% each. By occupation, Managers (14 workers) lead ahead of Professionals (9) and Clerical/Admin (8), a profile aligned with the IEO decile 9 score placing Rocky Point above most Australian suburbs on education and occupational advantage. The full-time employment rate is 61.5%, and unemployment records zero, though small sample sizes make precision limited. The participation rate of only 45.2% reflects 39 residents outside the labour force, consistent with the older median age of 52. Real incomes grew 13.6% over the decade and weekly household income of $1,833 sits at the 66.1st percentile nationally.
Unemployment
2.0%
Labour Force
4,894
Unemployed
99
Quarterly Trend
Source: SALM Dec-25
Socio-Economic Indexes (SEIFA)iABS index ranking suburbs from 1 (most disadvantaged) to 10 (most advantaged)
Full-time
61.5%
Part-time
38.5%
Participation
45.2%
Employed
52
Occupations
Top Industries
University
27.5%
Postgraduate
6.2%
Born Overseas
22.0%
Dwellings
50
Transport to Work
Car dependency is total: 100% of workers drive and no public transport use is recorded, typical for a low-density rural setting at 17.8 persons per square kilometre. The IRSAD decile of 8 places Rocky Point above most Australian suburbs on the combined advantage-disadvantage scale nationally. No schools are recorded within the suburb boundary, so families use services in nearby centres, a practical trade-off common to communities of this scale. Only 7.7% of residents (10 people) need daily assistance, below what the median age of 52 might suggest. Volunteering reaches 21.4%, above the national average, and the 90.4% residential stability rate reflects a community that stays by choice.
Drive
100.0%
Public Transport
N/A
Walk / Cycle
N/A
Work from Home
N/A
Population Forecast
+1.3%/yr
(+108 people/yr)
EstablishedThe broader local area recorded 9.4% population growth over 10 years, reaching 8,352 in 2024 after a 2.3% COVID dip that has fully recovered, sitting 4.4% above the pandemic low. Medium forecasts project 9,229 residents by 2031 at 1.3% annual growth. The gentrification score of 14 classifies the area as not gentrifying, consistent with a community already at IRSAD decile 8 with little demographic transformation expected. Affordability improved from 62.6% in 2011 to 46.1% in 2021, a 16-point gain that made the area more accessible relative to income over the decade. Internal migration runs at negative 89 per year, offset by overseas arrivals of positive 142, so net growth is entirely driven by international migration.
Historical + Forecast
Hamilton-Perry + Holt smoothing on ERP 2001-2025
Age Cohort Forecast
Primary Driver
Overseas Migration
Net Overseas / yr
+142
Net Internal / yr
-89
Gentrification Signal
Not gentrifying
Population +11% since 2011, COVID recovered (-2% dip → full recovery)
National Ranking iPercentile rank among ~15,000 AU suburbs. 90% = higher than 90% of suburbs
How Rocky Point compares to ~15,000 Australian suburbs
Frequently Asked Questions
Is Rocky Point a good suburb to live in?
Rocky Point scores decile 8 on the IRSAD advantage-disadvantage index, above the national median, and both mortgage-to-income (17.2%) and rent-to-income (19.1%) ratios sit well below stress thresholds. Household income is at the 66.1st percentile nationally. Trade-offs include 100% car dependency, no public transport, and no schools within the suburb boundary, typical for a rural community of 145 people.
What is the median house price in Rocky Point?
The estimated median house price is $416,000, derived from rental data for 2025. Monthly mortgage repayments average $1,365, giving a mortgage-to-income ratio of 17.2%, well below the 30% stress threshold. Weekly rent averages $350 and all dwellings are separate houses with no apartments or semi-detached stock.
What schools are in Rocky Point?
No schools are recorded within the Rocky Point suburb boundary. With 145 residents and a median age of 52, families rely on educational facilities in nearby larger centres. University qualifications reach 27.5% of residents, which is 2.6 percentage points below the national figure.
Is Rocky Point safe?
Detailed crime statistics are not available for Rocky Point. As indirect indicators, the suburb scores decile 8 on the IRSD relative disadvantage index, above the national median, and only 7.7% of its 145 residents need daily assistance. Community stability is high, with 90.4% of residents remaining in place over the 5 years prior to the Census, consistent with a settled, low-disadvantage profile.
Is Rocky Point good for property investment?
Weekly rent of $350 against an estimated $416,000 median implies a gross yield around 4.4%, above many coastal Queensland markets. The 19.7% vacancy rate is a caution signal, with nearly 1 in 5 dwellings empty. Zero development applications in the past 12 months means supply is not expanding, but resale liquidity in a 145-person suburb is a practical constraint for investors.
How is Rocky Point's population changing?
The local area recorded 9.4% population growth over 10 years, reaching 8,352 in 2024. Medium forecasts project 9,229 by 2031 at 1.3% annual growth. Overseas migration contributes a net 142 persons annually while internal migration averages negative 89, so growth depends on international arrivals. The suburb median age of 52 is 12 years above national, and the senior share rose 5.9 points over the decade.
How to read these comparisons
Phrases like "above the national average" reference the unweighted median across Australian suburbs with more than 1,000 residents, not population-weighted national figures. Suburb-level medians are more useful for ranking suburbs against each other; ABS census headlines are population-weighted (so dominated by Sydney and Melbourne) and can read very differently.
Current baseline (refreshed 2026-05-10): median age 40, university-educated 30.1%, born overseas 21.6%, average household size 2.5 people.
Data sources: ABS 2021 Census (demographics, income, tenure), state Valuer-General (house prices), Department of Jobs SALM (unemployment), ACARA (school ICSEA), state Crime Statistics agencies (offences), council DA portals (development applications). Population forecasts use a Hamilton-Perry cohort model calibrated to ABS ERP.
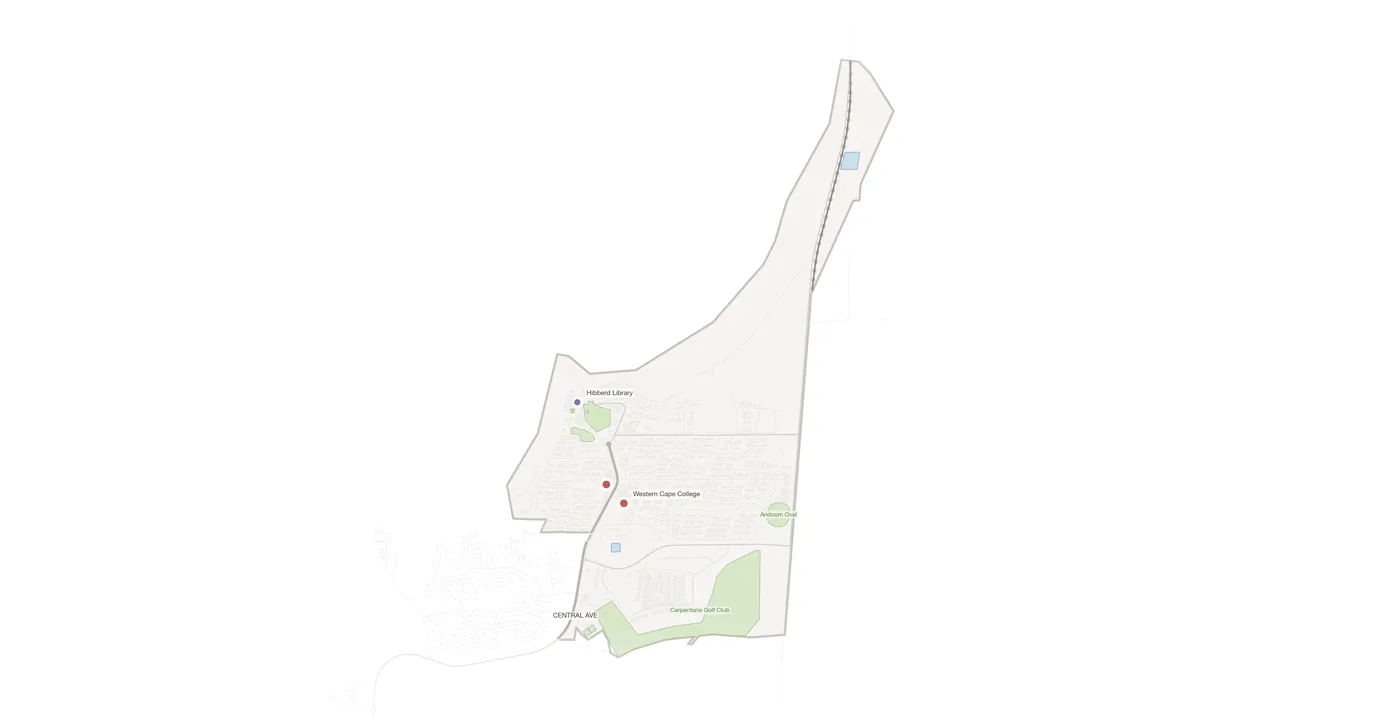
Explore Rocky Point on the Map
View parcels, zoning overlays, DA applications, schools and more.
Open Interactive Map