Woodend
Woodend ranks in the top decile nationally on both IRSD and IER, placing it well above average on economic resources and relative advantage, which is notable for a suburb where median house prices sit around $389,000, far below the national median. Packed into just 1.3 km2 with a density of 1,142 people per km2, the suburb's 1,483 residents are predominantly Australian-born with English, Irish and Scottish ancestry accounting for the top three heritage groups. Household income sits at the 56th percentile nationally, and 83.7% of workers commute by car, reflecting the suburb's car-dependent layout typical of outer southeast Queensland.
Population
1,483
Median Age
37.0
Household IncomeiMedian weekly household income (ABS Census)
$1,629/wk
DAs (12 months)iDevelopment Applications lodged in the past year
0
Median House
$389K
Estimated from rent (2025)
The estimated median house price of $389,000 makes Woodend one of the more affordable entry points in the Ipswich corridor, with 89.1% of dwellings being separate houses, above the national average. Monthly mortgage repayments average $1,452, and the mortgage-to-income ratio sits at 20.6%, below the 30% stress threshold, meaning most buyers are not stretched. Three-bedroom homes dominate at 53.2% of all dwellings, followed by 4-plus bedroom homes at 24.5%. Outright owners (27.0%) and mortgage holders (40.3%) together make up most of the tenure mix. Rent-to-income at 18.4% also stays comfortable, suggesting this market attracts both first-home buyers and upgraders looking for larger detached homes than inner Brisbane offers.
For Buyers
The estimated median house price of $389,000 makes Woodend one of the more affordable entry points in the Ipswich corridor, with 89.1% of dwellings being separate houses, above the national average. Monthly mortgage repayments average $1,452, and the mortgage-to-income ratio sits at 20.6%, below the 30% stress threshold, meaning most buyers are not stretched. Three-bedroom homes dominate at 53.2% of all dwellings, followed by 4-plus bedroom homes at 24.5%. Outright owners (27.0%) and mortgage holders (40.3%) together make up most of the tenure mix. Rent-to-income at 18.4% also stays comfortable, suggesting this market attracts both first-home buyers and upgraders looking for larger detached homes than inner Brisbane offers.
For Investors
Renters represent 32.6% of occupied dwellings, and weekly rent sits at $300, giving a gross yield estimate of roughly 4.0% against the $389,000 median, higher than inner Brisbane suburbs. The vacancy rate is 6.9%, above the 3% threshold considered balanced, which means rental demand is not tight. No development applications were recorded in the past 12 months, a signal of limited new supply but also limited near-term population pressure from construction. Net overseas migration adds an average of 34 residents a year compared to net internal migration of 16, providing a steady though modest base of rental demand. Population growth of 1.32% annually is consistent with outer southeast Queensland trends, supporting long-term demand for affordable rental stock.
Schools in Woodend iICSEA: school advantage index. 1000 = national avg, higher = more advantaged
St Edmund's College
5-12 · 1171 students
St Mary's Primary School
Prep-6 · 556 students
Demographics
The median age of 37 is 3 years below the national average, pointing to a relatively younger resident base compared to the national profile. University qualifications reach 30.4%, which is 0.3 percentage points above national, a near-average result for an outer suburban area. Overseas-born residents make up 12.1% of the population, 9.5 points below the national figure, reflecting a predominantly locally-born community. English, Irish and Scottish ancestries dominate the top three heritage groups, accounting for 599, 248 and 199 residents respectively. Average household size is 2.4, just below the national figure of 2.5, and 40.3% of families are couples with children, consistent with a family-oriented outer suburb. Volunteering participation stands at 16.3%, indicating moderate community engagement.
Age Distribution
Bedrooms
Dwelling Structure
89.1%
Houses
N/A
Townhouse
10.9%
Apartment
Tenure
Separate houses make up 89.1% of dwellings, markedly higher than the national average, with apartments accounting for the remaining 10.9%. Tenure divides into 27.0% outright owners, 40.3% on mortgages and 32.6% renting, a mortgage-belt profile where debt-funded ownership dominates. Three-bedroom homes account for 53.2% of stock, which is the clear majority, followed by 4-plus bedroom homes at 24.5% and 2-bedroom at 14.6%. The estimated median of $389,000 sits well below Brisbane's median, making Woodend a value-oriented market. Housing stress measures are benign: mortgage-to-income is 20.6% and rent-to-income is 18.4%, both below stress thresholds, because incomes at the 56th percentile nationally are relatively well matched to local price levels.
Mortgage / mo
$1,452
Rent / wk
$300
HH Size
2.4
Personal Income / wk
$744
Vacancy Ratei% of dwellings unoccupied on Census night (ABS 2021)
6.9%
Unoccupied
41
Rent / IncomeiMedian rent as % of household income. Over 30% = housing stress
18.4%
Mortgage / IncomeiMedian mortgage as % of household income. Over 30% = housing stress
20.6%
Community Profile
Ancestry
Household Composition
26.4%
Couples, no children
1,096
Total families
Economy & Employment
Education and Healthcare are the twin pillars of local employment, at 19.4% and 19.2% respectively, together absorbing nearly 40% of employed residents. Public Administration follows at 11.8%, Construction at 9.3% and Professional/Tech at 7.4%. By occupation, Professionals are the largest group (171 workers), followed by Community and Personal Services (105) and Managers (85). The unemployment rate is 7.8%, above typical Queensland suburban levels, with 52 unemployed people in a labour force of around 666. Full-time employment among those working stands at 67.4%, and participation rate is 55.5%, partly held down by the 415 residents not in the labour force. The suburb scores decile 9 on IRSD, placing it in the top 10% nationally for low disadvantage.
Unemployment
1.5%
Labour Force
4,056
Unemployed
62
Quarterly Trend
Source: SALM Dec-25
Socio-Economic Indexes (SEIFA)iABS index ranking suburbs from 1 (most disadvantaged) to 10 (most advantaged)
Full-time
67.4%
Part-time
24.8%
Participation
55.5%
Employed
614
Occupations
Top Industries
University
30.4%
Postgraduate
7.1%
Born Overseas
12.1%
Dwellings
542
Transport to Work
Car dependency is high: 83.7% of residents drive to work, which is above the national average, while only 2.5% use public transport, reflecting limited rail or bus frequency in this part of Ipswich. Walking and cycling account for 7.2% of commutes, a modest active-transport share. The suburb scores decile 8 on IRSAD, placing it in the top quintile nationally for advantage, and decile 9 on IRSD, indicating very low relative disadvantage. Crime data is not available for this suburb, so no crime rate comparison can be drawn. No schools are recorded within the 1.3 km2 boundary, so families rely on nearby Ipswich institutions. About 6.8% of residents (97 people) need daily assistance, slightly below national norms.
Drive
83.7%
Public Transport
2.5%
Walk / Cycle
7.2%
Work from Home
N/A
Population Forecast
+1.32%/yr
(+107 people/yr)
EstablishedThe suburb's population grew 24% over the 10 years to 2021, faster than most established Australian suburbs. Annual growth is projected at 1.32%, adding around 107 people per year, with the medium-scenario forecast placing the broader area at 8,811 residents by 2031 compared to around 8,084 in 2025. The gentrification score stands at 23 with early signs of change, supported by a 23% population increase since 2011 and a shift in the university-educated share from 7% to 15%. The aging trajectory is notable, with the senior share rising 8.1 points and the working-age share falling 5.1 points over the decade, a pattern common to outer suburbs as early settlers age in place. Affordability has worsened from 40.3% to 45.1% between 2011 and 2021, but the rent-growth rate of 56.8% over the period suggests landlords have captured significant value.
Historical + Forecast
Hamilton-Perry + Holt smoothing on ERP 2001-2025
Age Cohort Forecast
Primary Driver
Balanced
Net Overseas / yr
+34
Net Internal / yr
+16
Gentrification Signal
Early signs
Population +23% since 2011, Accelerating: 7% → 15%
National Ranking iPercentile rank among ~15,000 AU suburbs. 90% = higher than 90% of suburbs
How Woodend compares to ~15,000 Australian suburbs
Frequently Asked Questions
Is Woodend a good suburb to live in?
Woodend ranks in decile 8 on IRSAD and decile 9 on IRSD nationally, placing it in the top quintile for advantage and among the lowest for disadvantage. Housing costs are manageable, with a mortgage-to-income ratio of 20.6% and rent-to-income of 18.4%, both below stress thresholds. The main trade-off is high car dependency, with 83.7% of residents driving to work and limited public transport at 2.5%.
What is the median house price in Woodend?
The estimated median house price is $389,000, derived from rental data for 2025. Weekly rent averages $300 and monthly mortgage repayments average $1,452. Separate houses dominate at 89.1% of dwellings, giving buyers a wide choice of detached homes at prices well below Brisbane's median.
What schools are in Woodend?
No schools are recorded within Woodend's 1.3 km2 boundary in this dataset. Families rely on schools in nearby Ipswich suburbs. The local adult population has a university qualification rate of 30.4%, fractionally above the national average, suggesting education is valued by residents who access facilities elsewhere.
Is Woodend safe?
Detailed crime statistics are not available for Woodend in this dataset. As an indirect indicator, the suburb scores decile 9 on IRSD nationally, placing it among the lowest-disadvantage areas, a factor generally associated with lower crime rates. Only 6.8% of residents (97 people) need daily assistance, which is below typical national proportions.
Is Woodend good for property investment?
Weekly rent of $300 against an estimated median of $389,000 implies a gross yield of around 4.0%, higher than most inner Brisbane suburbs. The vacancy rate of 6.9% is above the balanced threshold of 3%, suggesting modest rather than strong rental demand. Population growth of 1.32% annually and no new development in the past 12 months support steady long-term demand without near-term oversupply risk.
How is Woodend's population changing?
The population grew 24% over the 10 years to 2021 and is projected to increase at 1.32% annually. The aging trajectory is notable: the senior share rose 8.1 points and the working-age share fell 5.1 points over the decade. Net overseas migration adds 34 residents a year and internal migration contributes 16, providing a balanced but modest growth base through to 2031.
How to read these comparisons
Phrases like "above the national average" reference the unweighted median across Australian suburbs with more than 1,000 residents, not population-weighted national figures. Suburb-level medians are more useful for ranking suburbs against each other; ABS census headlines are population-weighted (so dominated by Sydney and Melbourne) and can read very differently.
Current baseline (refreshed 2026-05-10): median age 40, university-educated 30.1%, born overseas 21.6%, average household size 2.5 people.
Data sources: ABS 2021 Census (demographics, income, tenure), state Valuer-General (house prices), Department of Jobs SALM (unemployment), ACARA (school ICSEA), state Crime Statistics agencies (offences), council DA portals (development applications). Population forecasts use a Hamilton-Perry cohort model calibrated to ABS ERP.
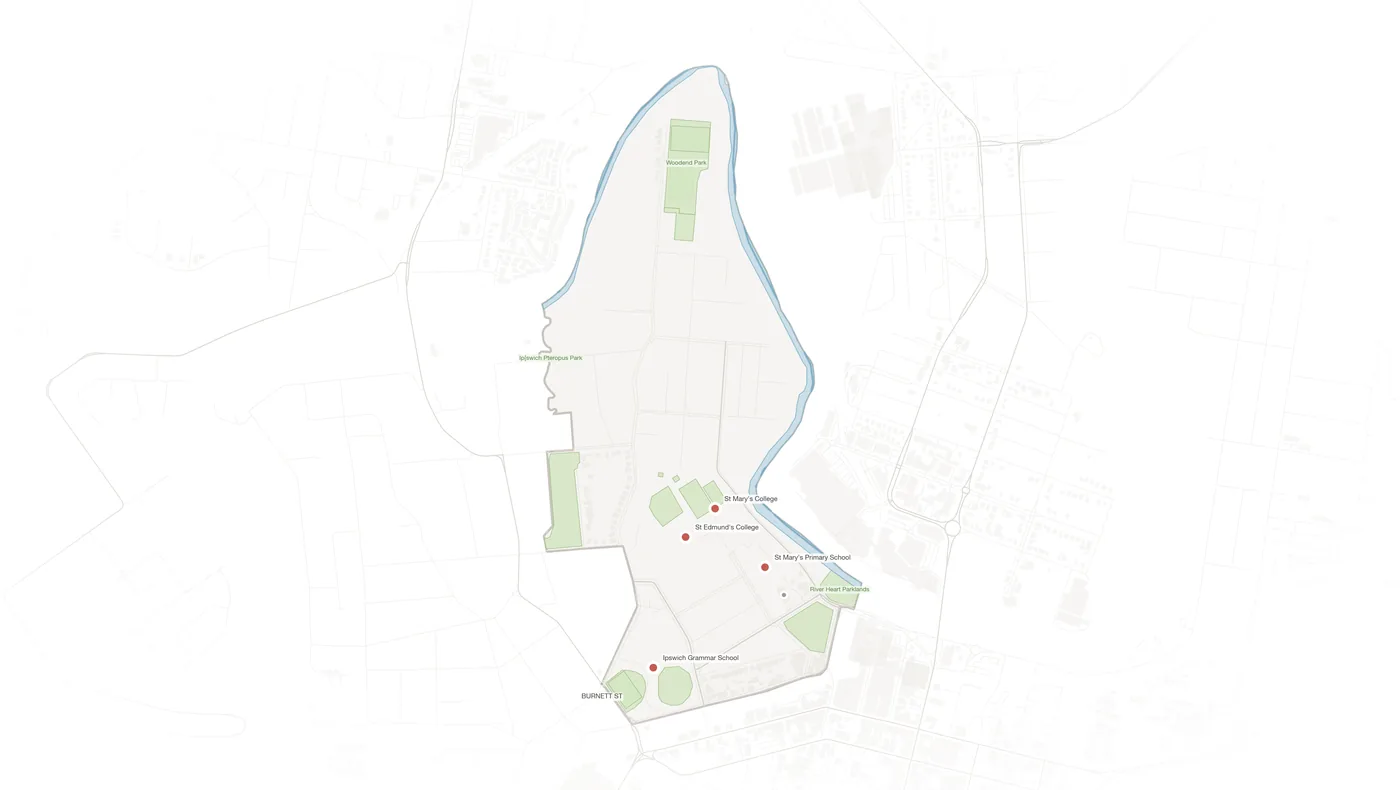
Explore Woodend on the Map
View parcels, zoning overlays, DA applications, schools and more.
Open Interactive Map