
Queensland has the lowest ICSEA scores of any mainland Australian state. The mean is 984, below every state except the Northern Territory. Only 22% of schools score above 1,050, compared to 39% in Victoria. And only 2.4% of Queensland suburbs qualify as triple-strong across childcare, primary, and secondary, compared to 7.0% in Victoria and 6.0% in NSW.
These numbers do not necessarily mean Queensland schools are worse. ICSEA measures community socio-educational advantage, not teaching quality. Queensland has a larger remote population, a lower proportion of university-educated parents in outer suburbs, and a more decentralised population spread. The ICSEA formula weights all of these factors, which lowers the state average.
But if you are using ICSEA to compare school zones for a property decision, these structural differences matter. A suburb averaging 1,080 in Queensland sits in the top 22% of the state. The same score in Victoria puts you in the middle of the pack.
Queensland vs the Other States
| State | Schools | Mean ICSEA | Median | >= 1,050 | >= 1,100 | Triple-strong suburbs |
|---|---|---|---|---|---|---|
| VIC | 2,290 | 1,032 | 1,027 | 39.3% | 20.0% | 60 (7.0%) |
| NSW | 3,146 | 1,004 | 1,006 | 33.4% | 17.1% | 79 (6.0%) |
| QLD | 1,779 | 984 | 985 | 22.0% | 10.5% | 21 (2.4%) |
| WA | 1,115 | 994 | 1,004 | 28.7% | 13.9% | -- |
| SA | 701 | 1,003 | 999 | 28.2% | 11.0% | -- |
The Government-Independent Gap
ICSEA gaps between government and independent schools reveal how much of a suburb's score is driven by community demographics versus school choice:
| State | Government Avg | Independent Avg | Gap |
|---|---|---|---|
| NSW | 981 | 1,061 | +79 |
| QLD | 962 | 1,034 | +72 |
| VIC | 1,017 | 1,082 | +65 |
Queensland's gap of 72 points is the middle of the pack. But the absolute level of government schools is the issue: QLD government schools average 962, which is 55 points below Victoria's 1,017. That gap is not about school quality. It is about community demographics, remoteness weighting, and population distribution.
Victoria's government schools start from a higher base because Victoria is more urbanised, has a smaller remote population, and has a higher proportion of university-educated parents statewide. The ICSEA formula reflects all of these demographic characteristics.
Brisbane's Top 20 Suburbs by School Quality
Suburbs with the highest average ICSEA (minimum 3 schools):
| Rank | Suburb | Schools | Avg ICSEA |
|---|---|---|---|
| 1 | Bardon | 4 | 1,173 |
| 2 | Toowong | 6 | 1,162 |
| 3 | Ashgrove | 5 | 1,156 |
| 4 | Brisbane CBD | 5 | 1,153 |
| 5 | Clayfield | 4 | 1,150 |
| 6 | Indooroopilly | 6 | 1,149 |
| 7 | South Brisbane | 3 | 1,147 |
| 8 | Kenmore | 4 | 1,141 |
| 9 | Kelvin Grove | 3 | 1,140 |
| 10 | Enoggera | 3 | 1,135 |
| 11 | The Gap | 5 | 1,132 |
| 12 | Dutton Park | 3 | 1,131 |
| 13 | Fig Tree Pocket | 3 | 1,127 |
| 14 | Buderim | 3 | 1,124 |
| 15 | Corinda | 4 | 1,115 |
| 16 | Kedron | 5 | 1,113 |
| 17 | Cannon Hill | 3 | 1,112 |
| 18 | Carindale | 3 | 1,110 |
| 19 | Camp Hill | 3 | 1,102 |
| 20 | Mansfield | 3 | 1,101 |
The top is concentrated in a 5km strip from Bardon through Toowong to Indooroopilly, all following the western rail corridor. Drop below the top 10 and the scores fall away more steeply than in Sydney or Melbourne.
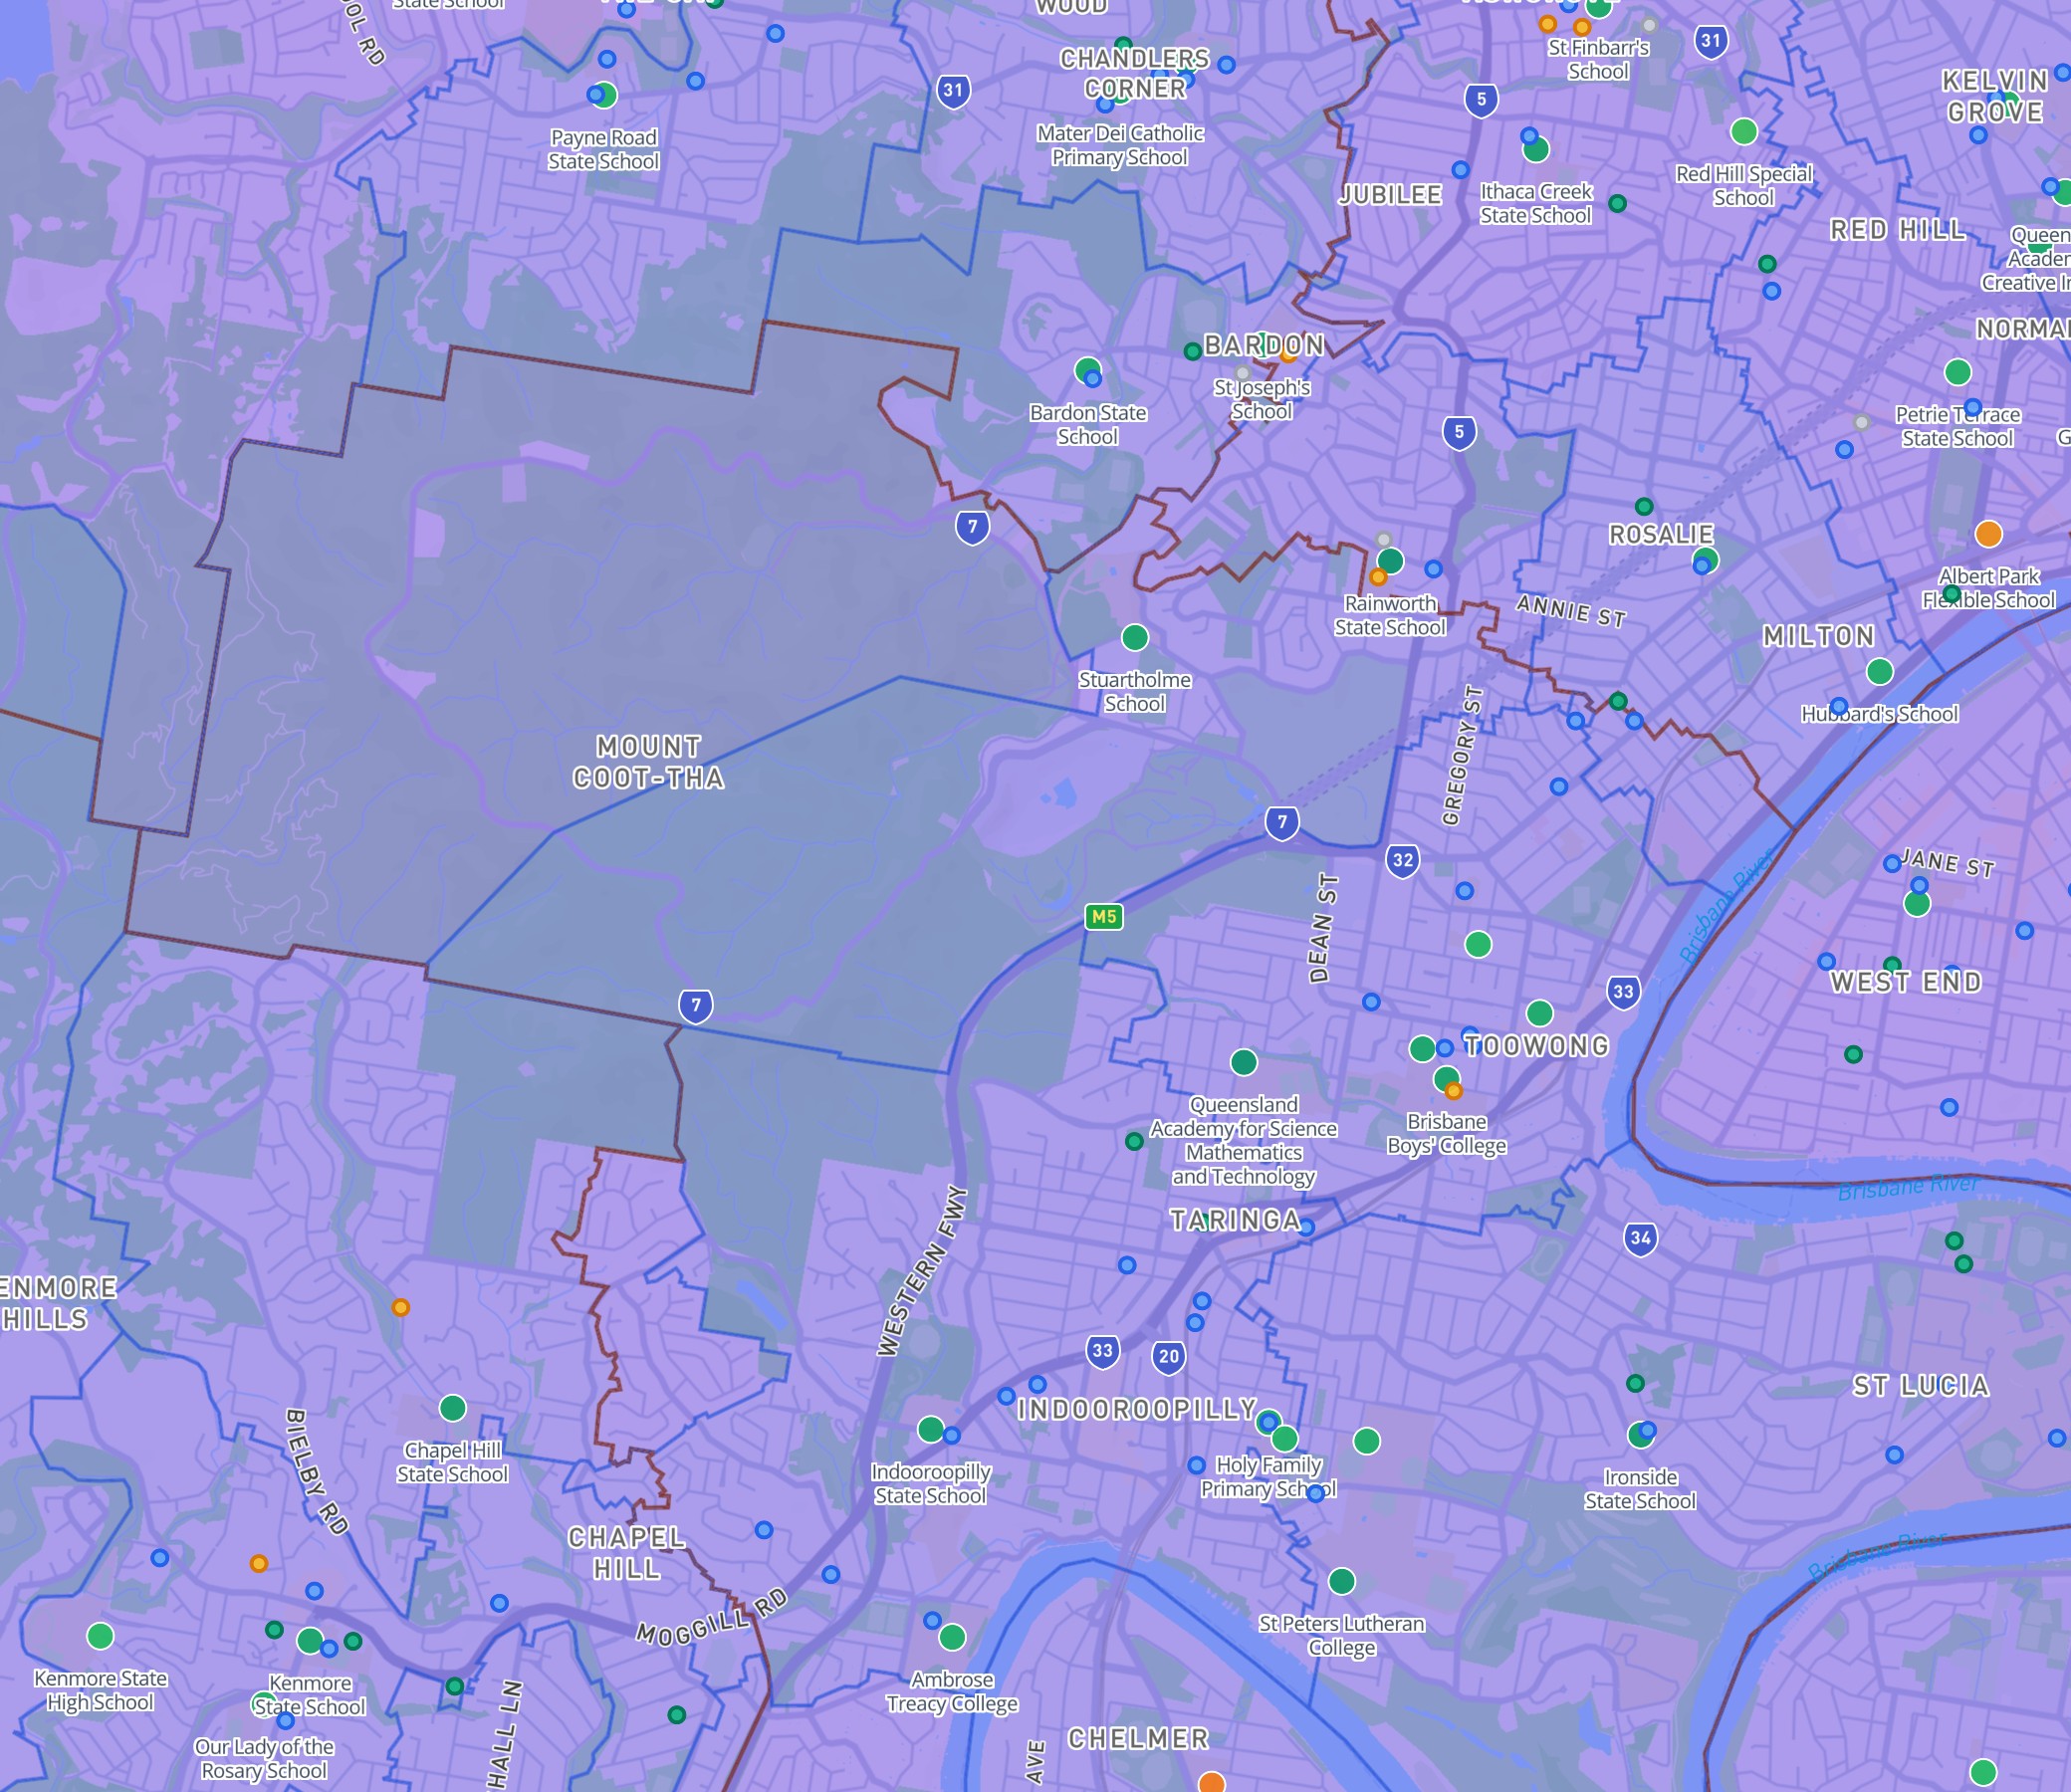
Brisbane's western corridor on the DA Leads map. The green cluster from Bardon through Toowong to Indooroopilly is Brisbane's only continuous band of high-ICSEA suburbs. Compare with the colour shift toward yellow and orange in Logan to the south.
The 21 Triple-Strong Suburbs
Only 21 Queensland suburbs qualify as triple-strong. For context, Greater Melbourne has 60 and Greater Sydney has 79.
| Suburb | Pri ICSEA | Sec ICSEA | CC Avg | CC Services |
|---|---|---|---|---|
| Milton | 1,151 | 1,143 | 3.3 | 3 |
| Indooroopilly | 1,154 | 1,138 | 3.0 | 10 |
| Enoggera | 1,116 | 1,174 | 3.0 | 9 |
| Kenmore | 1,151 | 1,110 | 3.1 | 13 |
| The Gap | 1,134 | 1,123 | 3.1 | 10 |
| Kedron | 1,119 | 1,106 | 3.2 | 8 |
| Holland Park West | 1,135 | 1,055 | 3.3 | 3 |
| Nundah | 1,089 | 1,079 | 3.3 | 6 |
| Holland Park | 1,081 | 1,103 | 3.1 | 10 |
| Ferny Grove | 1,082 | 1,069 | 3.4 | 5 |
| Carina | 1,092 | 1,080 | 3.2 | 6 |
| Mount Gravatt | 1,101 | 1,079 | 3.0 | 10 |
| Corinda | 1,116 | 1,060 | 3.0 | 9 |
| Sippy Downs | 1,081 | 1,073 | 3.1 | 8 |
| Chermside West | 1,070 | 1,070 | 3.2 | 6 |
| Burleigh Waters | 1,064 | 1,073 | 3.2 | 5 |
| Albany Creek | 1,065 | 1,055 | 3.2 | 11 |
The list runs out before we hit 20. That is the point: Queensland does not have the depth of school-strong suburbs that southern states do.
Why Brisbane's School Data Looks Weak (and What It Actually Means)
Three structural factors explain Queensland's lower numbers:
1. More remote schools. Queensland has proportionally more schools outside metro areas than Victoria. ICSEA weights remoteness as a factor, so the state average is lowered by a long tail of rural and remote schools that have no equivalent in Victoria.
2. Population distribution. Victoria has 77% of its population in Greater Melbourne. Queensland has 48% in Greater Brisbane. More population outside the capital means more schools in areas with lower parental education and occupation scores, both of which weight heavily in ICSEA.
3. Smaller independent sector. Queensland has fewer independent schools per capita than Victoria or NSW. Since independent schools consistently score 65-80 ICSEA points above government schools (driven by parental demographics, not teaching), fewer independents means a lower state average.
Queensland Childcare: Lower Exceeding Rate, Same Pattern
Queensland childcare follows the same pattern as its schools: lower absolute scores, but the same structural relationships.
Only 14.8% of Queensland childcare services are rated Exceeding NQS, compared to 23.4% in Victoria and 19.2% in NSW. The QA exceeding rates by state tell the story:
| QA | QLD | VIC | NSW |
|---|---|---|---|
| QA1 Educational program | 15.4% | 23.5% | 21.0% |
| QA5 Relationships | 16.0% | 27.2% | 18.4% |
| QA6 Partnerships | 18.4% | 28.0% | 23.1% |
| QA7 Governance | 12.2% | 17.1% | 16.7% |
Queensland underperforms Victoria by 8-12 percentage points on every quality area. Whether this reflects genuine quality differences or assessment variation between state regulatory bodies is an open question.
Ferny Grove (3.4 average, 40% Exceeding) is the strongest childcare suburb among Queensland's triple-strong list. St Lucia (3.43 average) and Bulimba (3.60) rank highest statewide but lack the school depth to be triple-strong.
Where Schools Are Weakest
| Suburb | Schools | Avg ICSEA |
|---|---|---|
| Murgon | 3 | 830 |
| Caboolture | 7 | 932 |
| Woodridge | 6 | 936 |
| Inala | 5 | 940 |
| Logan Central | 4 | 941 |
Logan and Caboolture appear here consistently. As growth corridors, they face the same challenge as western Sydney and Melbourne's north: population growth outpacing school infrastructure.
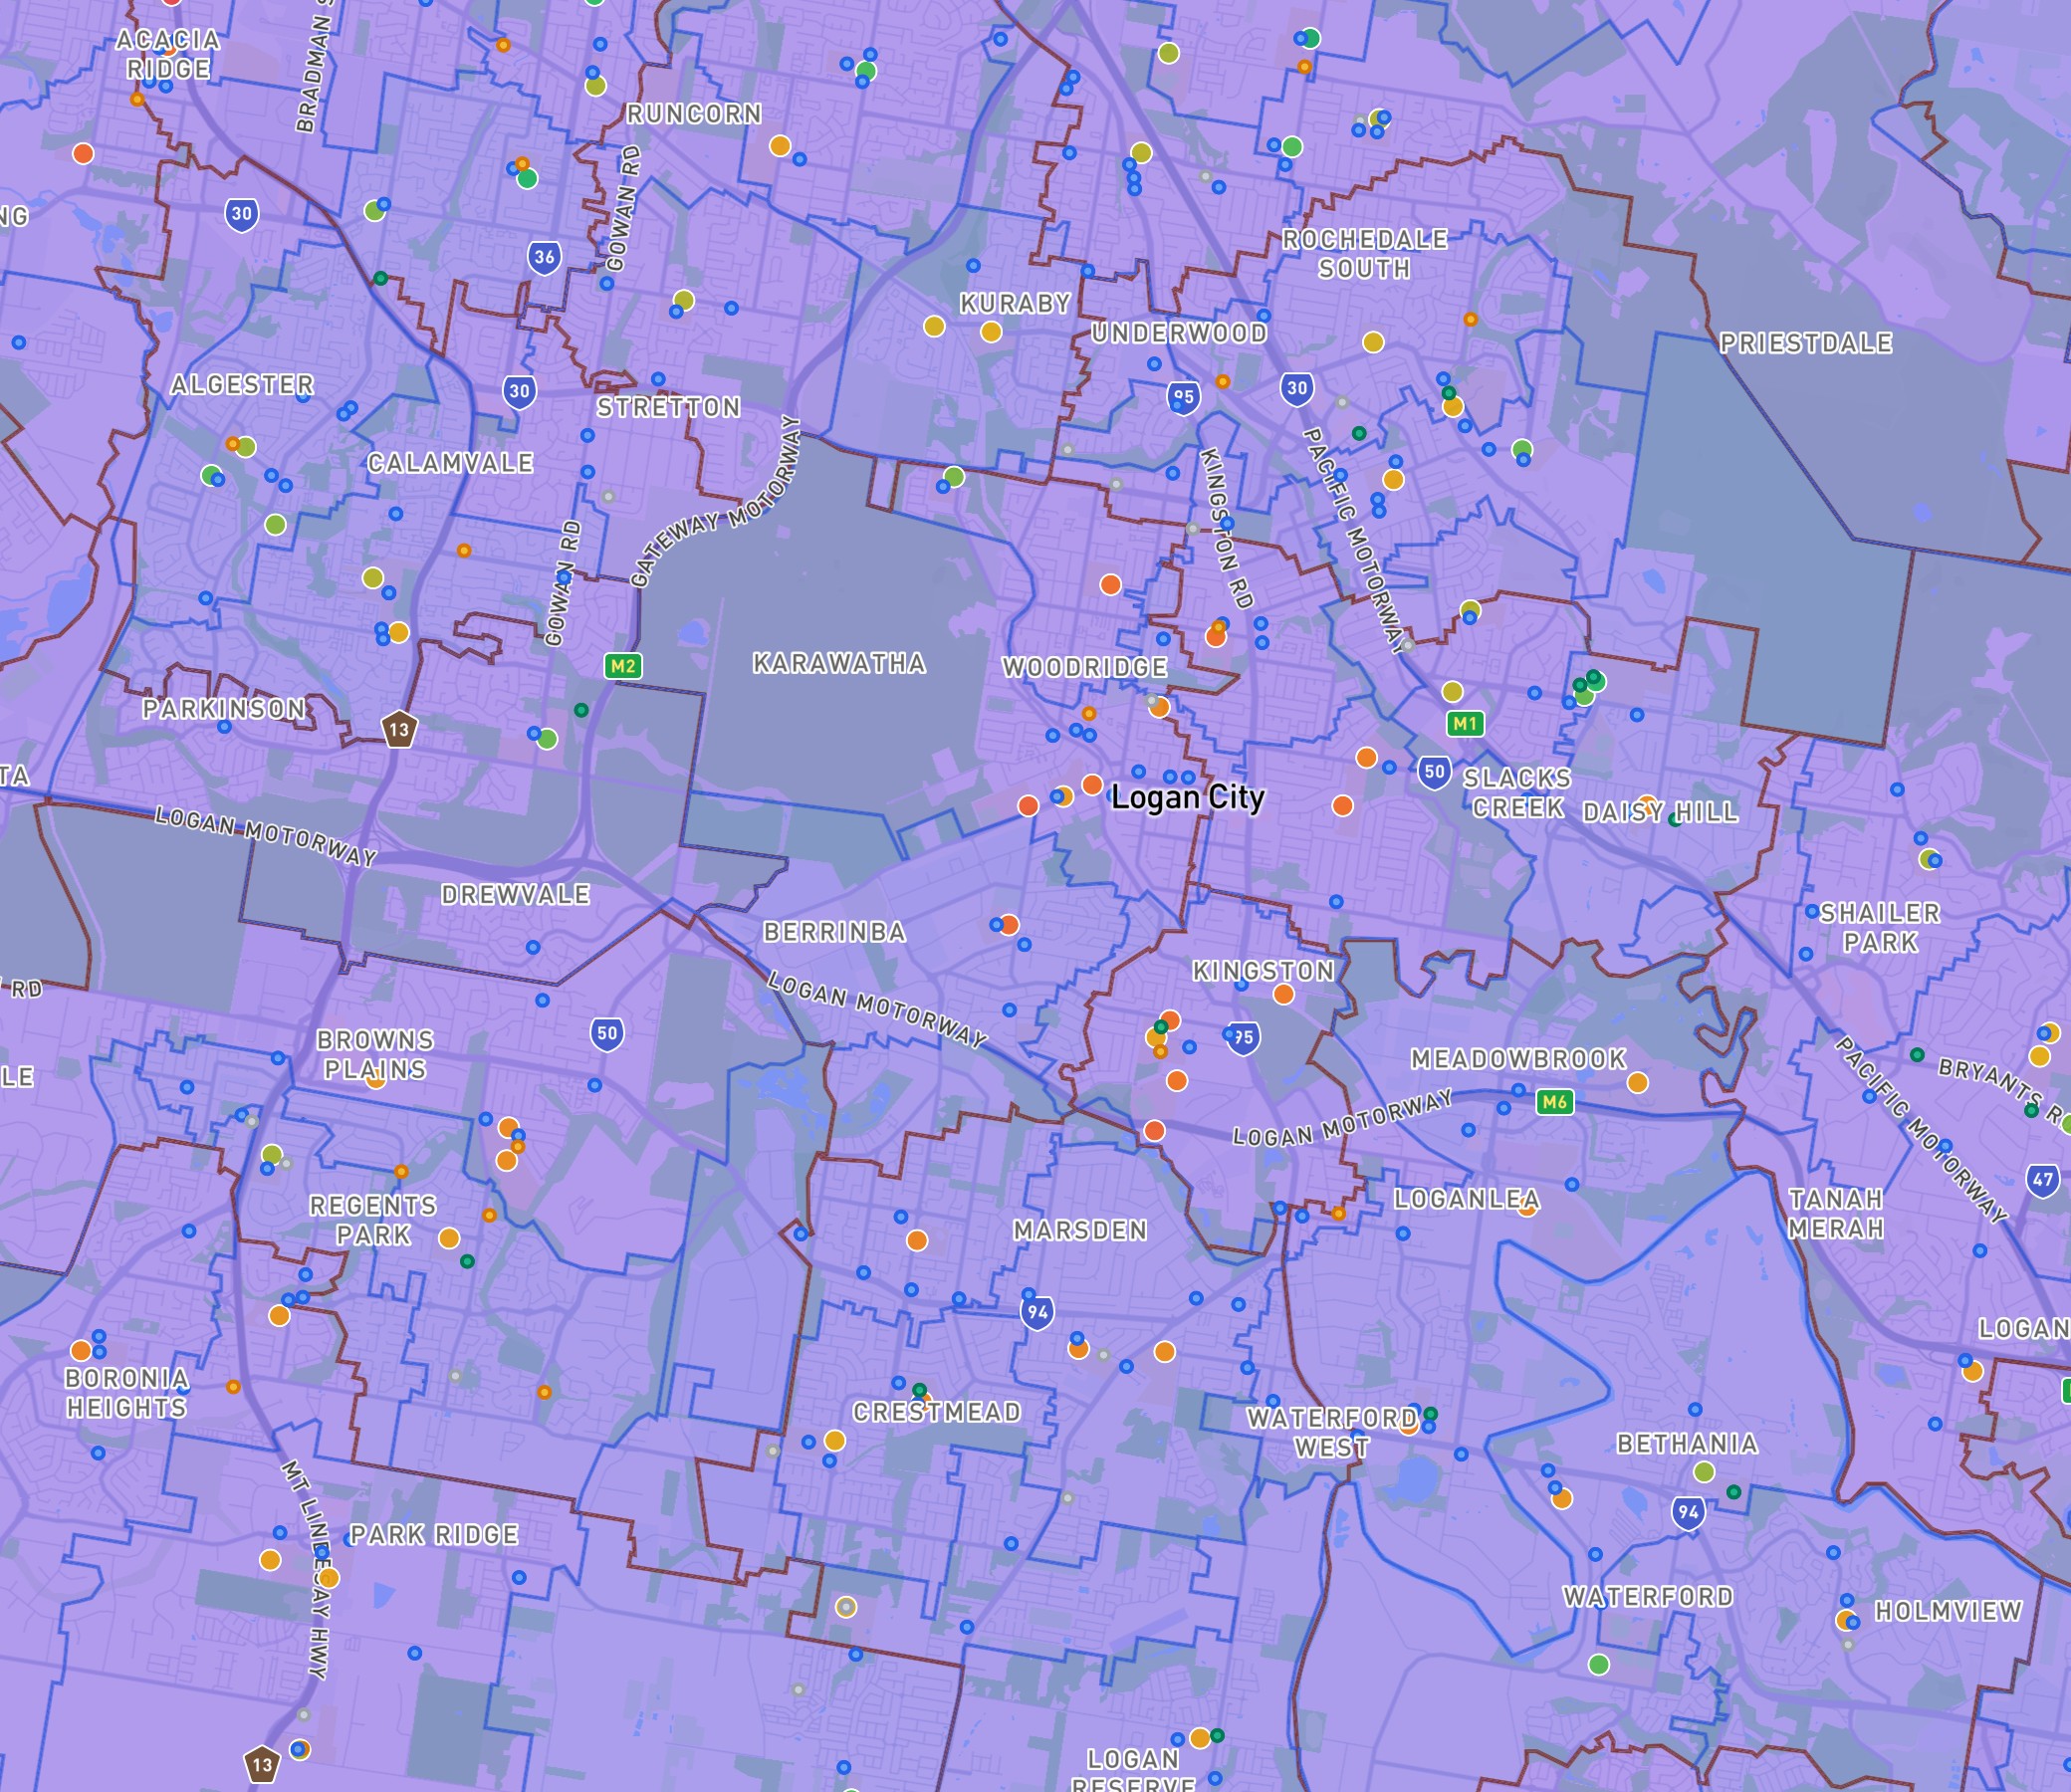
Brisbane's southern growth corridor: the colour shift from green in the inner west to orange and red in Logan, Woodridge, and Browns Plains is visible at a glance. Each dot is a school you can click for ICSEA score and details.
Explore School Data on the Map
All school and childcare data is available on the DA Leads interactive map. Search any Brisbane address to see nearby schools colour-coded by ICSEA, childcare services by NQS rating, and catchment boundaries.
Open the interactive map with Schools & Childcare layer
Methodology
School data: ACARA School Profile 2025, 1,779 QLD schools. Childcare data: ACECQA National Register, 3,168 QLD services. Triple-strong threshold: Primary ICSEA >= 1,050, secondary >= 1,050, childcare NQS >= 3.0, minimum 3 rated services. State comparison: Same methodology applied to VIC (2,290 schools) and NSW (3,146 schools) for cross-state comparison. Limitations: ICSEA measures community advantage, not teaching quality. Cross-state ICSEA comparisons should use percentile rather than raw score.


