
On the North Shore, government schools average an ICSEA of 1,149. That is higher than the overall average of the Eastern Suburbs, where houses cost twice as much.
In the Eastern Suburbs, the gap between government and independent school ICSEA scores is 1 point. One. In most Australian cities, that gap is 65 to 80 points. The Eastern Suburbs is the only corridor in Sydney where paying for private school buys you essentially zero ICSEA advantage over the local public school.
These are the kinds of patterns that appear when you stop ranking suburbs and start cross-referencing the data. We analysed 3,146 NSW schools (ACARA ICSEA scores) and 5,786 childcare services (ACECQA NQS ratings). Here is what the rankings obscure.
The Rankings (for Reference)
Before the analysis, here are the raw numbers. Sydney's top 20 suburbs by average ICSEA (minimum 3 schools):
| Rank | Suburb | Schools | Avg ICSEA |
|---|---|---|---|
| 1 | Woollahra | 3 | 1,187 |
| 2 | North Sydney | 5 | 1,183 |
| 3 | Crows Nest | 3 | 1,178 |
| 4 | Normanhurst | 3 | 1,170 |
| 5 | Beecroft | 3 | 1,167 |
| 6 | Mosman | 7 | 1,167 |
| 7 | Bellevue Hill | 3 | 1,166 |
| 8 | Paddington | 3 | 1,166 |
| 9 | Pymble | 5 | 1,163 |
| 10 | Balmain | 4 | 1,163 |
| 11 | Rose Bay | 4 | 1,160 |
| 12 | Stanmore | 3 | 1,160 |
| 13 | Summer Hill | 3 | 1,157 |
| 14 | Lane Cove | 6 | 1,156 |
| 15 | Cherrybrook | 4 | 1,155 |
| 16 | Girraween | 3 | 1,153 |
| 17 | Killara | 3 | 1,153 |
| 18 | Willoughby | 3 | 1,152 |
| 19 | Balgowlah | 4 | 1,152 |
| 20 | Wahroonga | 9 | 1,150 |
The Eastern Suburbs and North Shore alternate through the top 20. At a glance, they look equivalent. They are not.
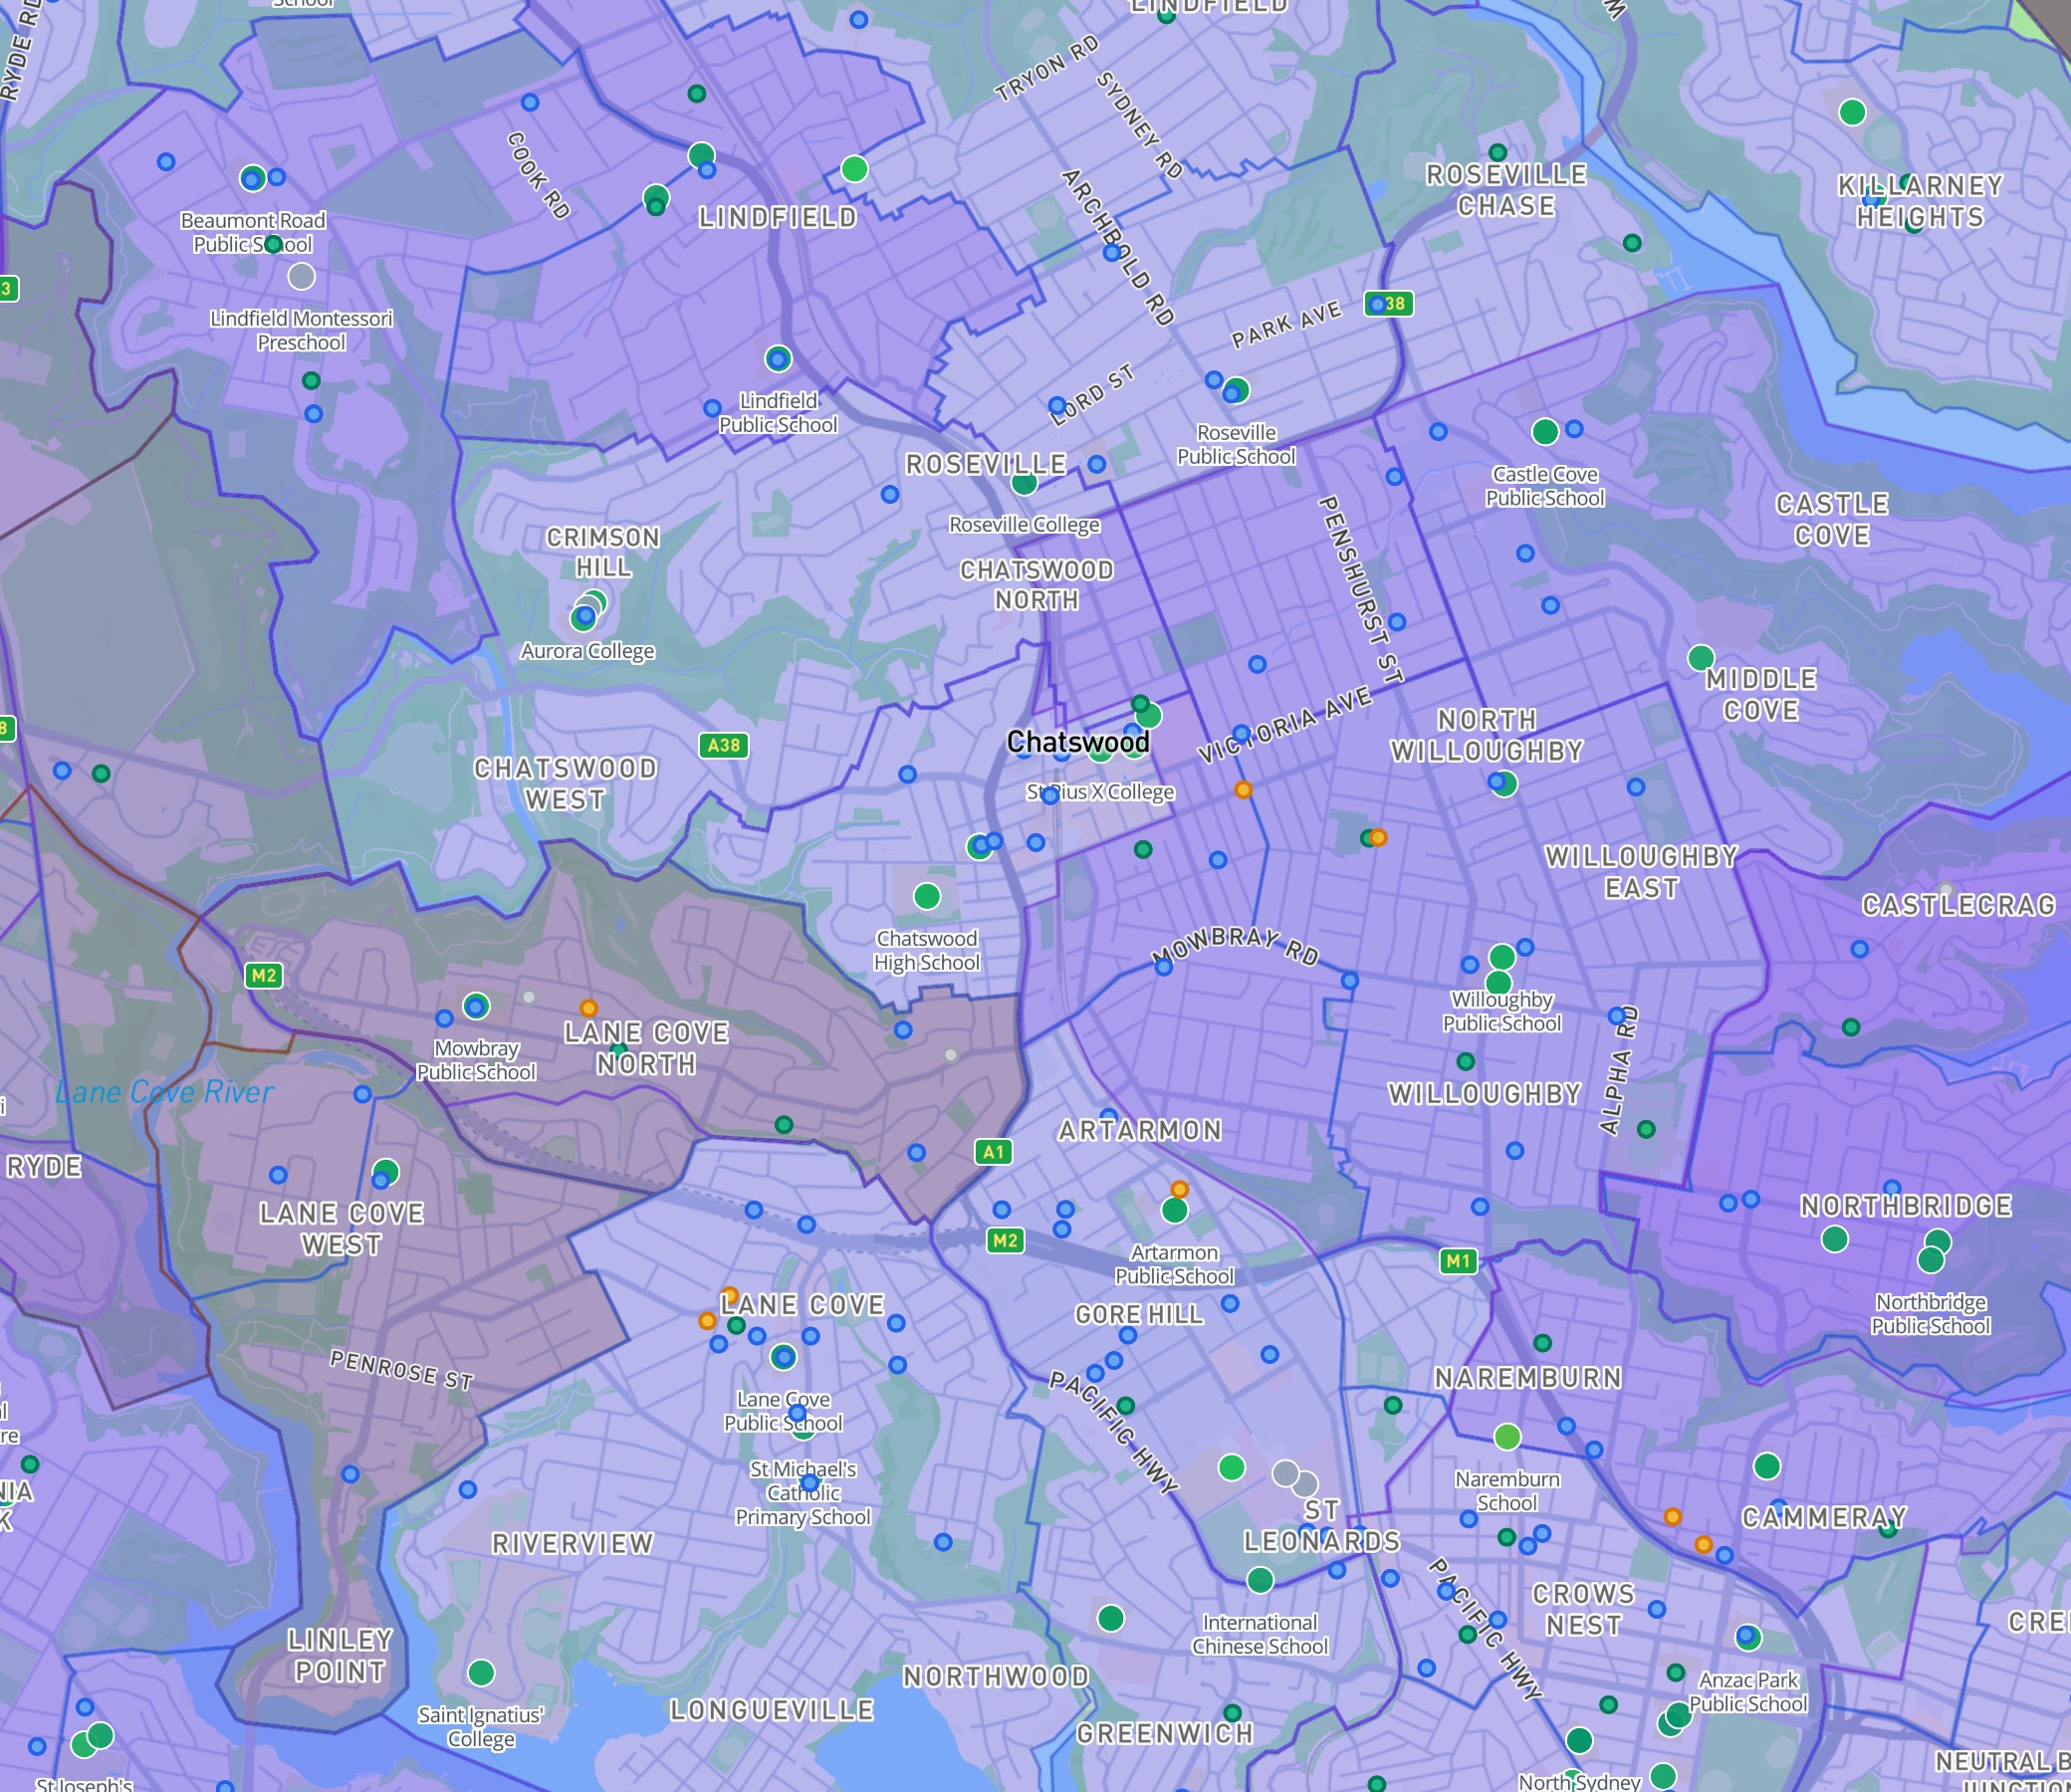
The North Shore corridor on the DA Leads map, from Mosman to Hornsby. Schools are colour-coded by ICSEA percentile: green dots indicate top-quartile scores. The corridor stretches 20km but maintains consistently high ICSEA throughout.
North Shore vs Eastern Suburbs: The Gap That Property Prices Miss
We separated all schools in these two corridors and compared them across multiple dimensions:
| Metric | North Shore (20 suburbs) | Eastern Suburbs (15 suburbs) |
|---|---|---|
| Total schools | 80 | 51 |
| Average ICSEA | 1,152 | 1,132 |
| Median ICSEA | 1,161 | 1,148 |
| Government school avg | 1,149 | 1,131 |
| Independent school avg | 1,157 | 1,132 |
| Gov-Ind gap | 9 points | 1 point |
| Childcare services | 230 | 141 |
| Childcare avg NQS | 3.19 | 3.11 |
This does not mean the schools are identical. ICSEA measures community profile, not teaching quality. An independent school in the Eastern Suburbs may still deliver better teaching, smaller classes, or different curriculum. But the demographic input to the ICSEA calculation is the same for both sectors, which tells you something about how socially homogeneous the Eastern Suburbs actually is.
The North Shore scores higher on every metric we measured: higher averages, higher government school floors, more childcare services, and higher childcare quality. The Eastern Suburbs is competitive at the very top of the distribution: Woollahra (1,187) edges out North Sydney (1,183). But across the full range of suburbs, the North Shore has more depth and breadth.
The 79 Triple-Strong Suburbs
Sydney has 79 suburbs where childcare, primary, and secondary education all meet a strong baseline (primary ICSEA >= 1,050, secondary >= 1,050, childcare NQS >= 3.0). That is more than Melbourne (60) or Brisbane (21).
The top 20:
| Suburb | Pri ICSEA | Sec ICSEA | CC Avg | CC Services |
|---|---|---|---|---|
| North Sydney | 1,179 | 1,179 | 3.1 | 13 |
| Normanhurst | 1,139 | 1,207 | 3.2 | 4 |
| Petersham | 1,133 | 1,176 | 3.4 | 5 |
| Killarney Heights | 1,150 | 1,132 | 3.7 | 3 |
| Killara | 1,156 | 1,147 | 3.4 | 8 |
| Hornsby | 1,117 | 1,209 | 3.1 | 18 |
| Willoughby | 1,152 | 1,152 | 3.2 | 9 |
| Manly | 1,155 | 1,113 | 3.4 | 9 |
| Mosman | 1,174 | 1,126 | 3.1 | 19 |
| Newtown | 1,137 | 1,127 | 3.4 | 9 |
| Pennant Hills | 1,145 | 1,128 | 3.3 | 7 |
| St Ives | 1,143 | 1,136 | 3.2 | 22 |
| Epping | 1,144 | 1,140 | 3.1 | 17 |
| Wahroonga | 1,153 | 1,113 | 3.2 | 18 |
| Castle Hill | 1,138 | 1,114 | 3.3 | 31 |
| Baulkham Hills | 1,138 | 1,126 | 3.1 | 32 |
| Cronulla | 1,093 | 1,075 | 3.5 | 10 |
| Wollongong | 1,053 | 1,145 | 3.4 | 18 |
| Concord | 1,087 | 1,068 | 3.3 | 11 |
| Sutherland | 1,093 | 1,093 | 3.3 | 10 |
Note that 79 triple-strong sounds like a lot, but it is 6.0% of NSW's 1,315 suburbs with schools. Victoria achieves 7.0%. The raw count is higher because NSW has more suburbs, not because the state performs better.
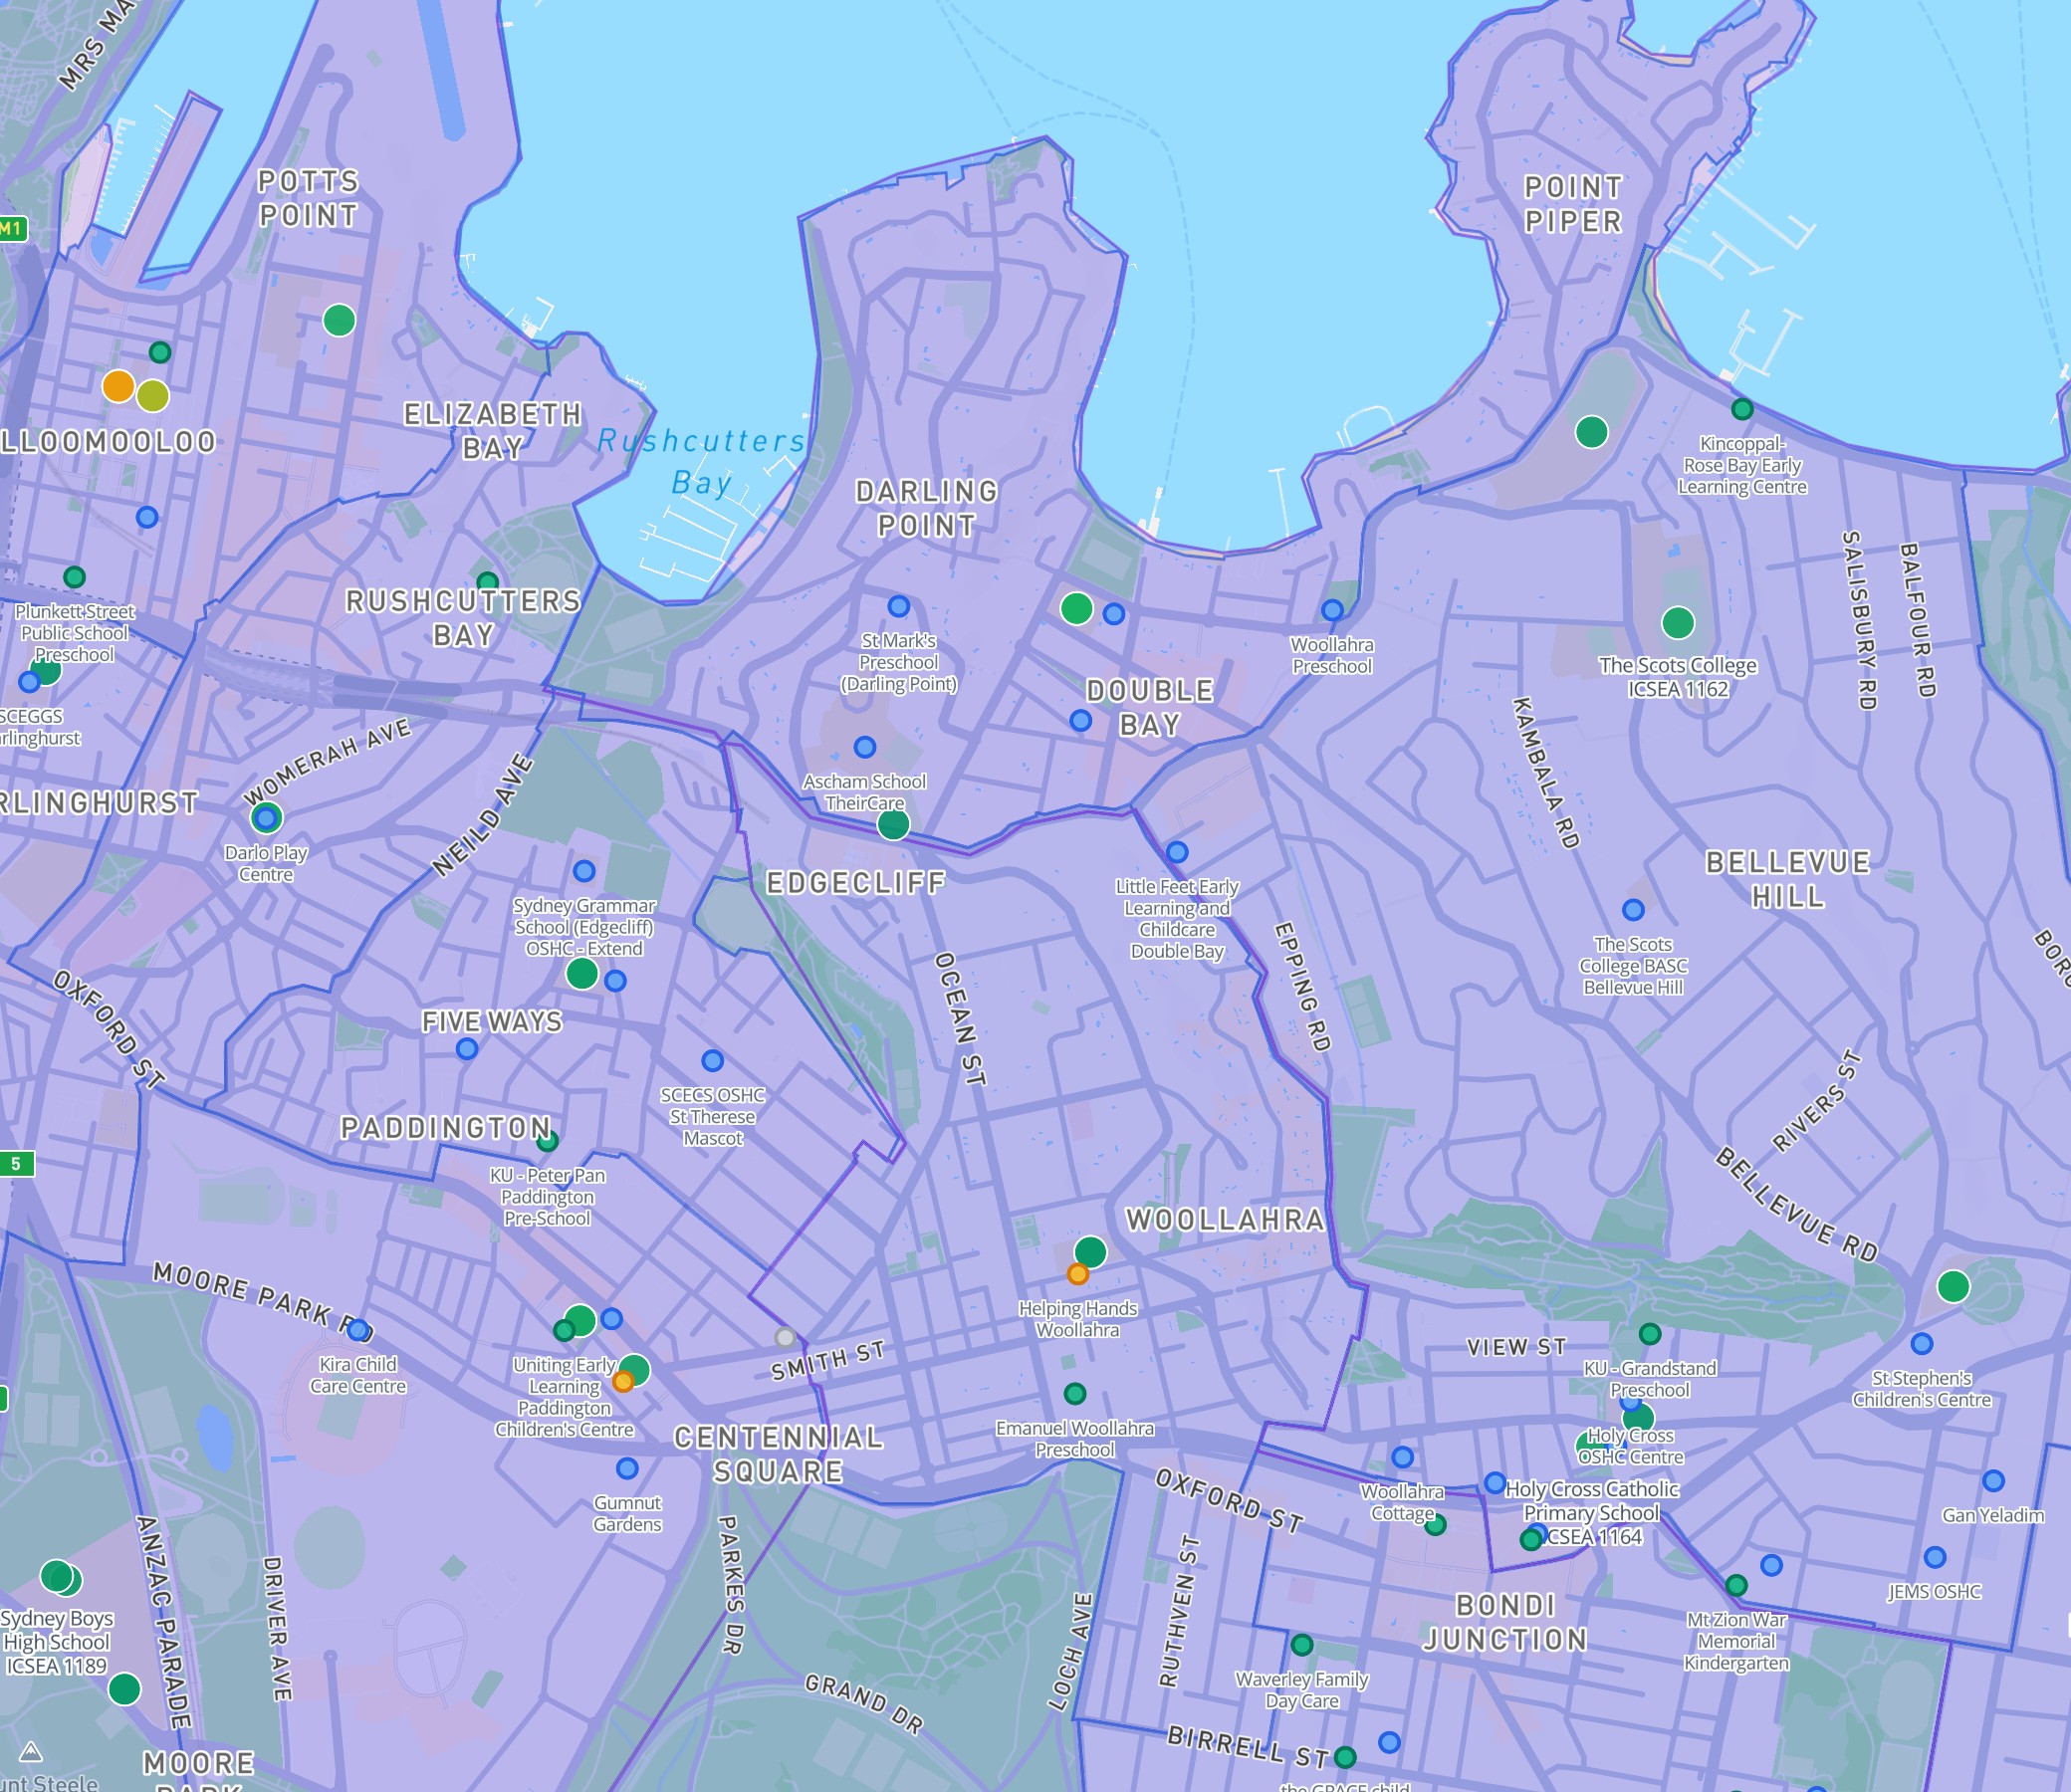
Eastern Suburbs on the DA Leads map: Woollahra (1,187), Paddington, Waverley, and Randwick. Note the 1-point gap between government and independent ICSEA in this corridor, the smallest in Sydney.
The Selective School Question
We expected selective schools to significantly distort suburb averages. They don't. Across all NSW suburbs with both selective and non-selective schools, only Crows Nest shows a distortion greater than 30 points. North Sydney Boys High (ICSEA 1,195) pushes the Crows Nest average up by 43 points.
Everywhere else, the effect is small. Hornsby Girls High (1,209) is the highest-ICSEA school in NSW, but Hornsby has enough other strong schools that removing it barely changes the suburb average. The data does not support the common belief that selective schools artificially inflate suburb-level rankings.
The Childcare Inversion: Regional NSW Beats the City
This is the finding that would surprise most Sydney parents. We split NSW childcare services by location:
| Region | Services | Exceeding | Exceeding % | Working Towards % |
|---|---|---|---|---|
| Sydney metro | 3,652 | 628 | 17.2% | 6.7% |
| Regional NSW | 2,134 | 484 | 22.7% | 7.3% |
Regional NSW childcare is 32% more likely to be rated Exceeding NQS than Sydney metro. The Working Towards rate is marginally higher in regional areas (7.3% vs 6.7%), but the top-end quality gap is substantial.
This matches the suburb-level data: the top-ranked childcare suburbs in NSW are Ballina (78% Exceeding), Kiama (62%), Bulli (57%), and Wauchope (56%). All regional. The best metro suburbs (Crows Nest 56%, Lilyfield 56%) match them, but the overall distribution favours the regions.
Possible explanations: lower staff turnover in regional centres, more stable communities, smaller centre sizes, and less cost pressure driving corner-cutting. We cannot prove causation from this data, but the pattern is consistent across every state we have analysed.
Where Schools Are Weakest
| Suburb | Schools | Avg ICSEA |
|---|---|---|
| Bourke | 3 | 683 |
| Brewarrina | 3 | 694 |
| Moree | 6 | 832 |
| Mount Druitt | 7 | 896 |
| Claymore | 3 | 919 |
The gap between Woollahra (1,187) and Bourke (683) is 504 ICSEA points. Both are in NSW. ICSEA reflects community advantage, and that advantage is distributed extremely unevenly.
NSW in National Context
NSW sits in the middle of Australian states on school quality:
| State | Schools | Mean ICSEA | Median | >= 1,050 | >= 1,100 |
|---|---|---|---|---|---|
| VIC | 2,290 | 1,032 | 1,027 | 39.3% | 20.0% |
| NSW | 3,146 | 1,004 | 1,006 | 33.4% | 17.1% |
| SA | 701 | 1,003 | 999 | 28.2% | 11.0% |
| WA | 1,115 | 994 | 1,004 | 28.7% | 13.9% |
| QLD | 1,779 | 984 | 985 | 22.0% | 10.5% |
Victoria, not NSW, has the highest ICSEA mean (1,032) and the highest proportion of schools above 1,050 (39.3%). NSW's mean of 1,004 is close to the national average of 1,000. The state's top suburbs score among the highest in Australia, but its distribution is wider and its floor is lower.
Explore School Data on the Map
All school and childcare data is available on the DA Leads interactive map. Search any Sydney address to see nearby schools colour-coded by ICSEA, childcare services by NQS rating, and catchment zone boundaries.
Open the interactive map with Schools & Childcare layer
Methodology
School data: ACARA School Profile 2025, 3,146 NSW schools. ICSEA calculated by ACARA from parental occupation, parental education, remoteness, and Indigenous student proportion. Special schools excluded.
Childcare data: ACECQA National Register, 5,786 NSW services. Metro/regional split based on coordinates: Sydney metro defined as lat -34.2 to -33.4, lng 150.5 to 151.5.
Gov-Ind analysis: Schools classified by ACARA sector field. North Shore defined as 20 suburbs from North Sydney to Normanhurst. Eastern Suburbs defined as 15 suburbs from Woollahra to Clovelly.
Limitations: ICSEA measures community advantage, not teaching quality. NQS assesses operational quality, not child outcomes. The 1-point gov-ind gap in the Eastern Suburbs does not mean the schools are interchangeable; it means the demographic inputs to ICSEA are identical.
Sources
- ACARA Data Access Program - School Profile 2025
- ACECQA National Register
- DA Leads Interactive Map
- What ICSEA Actually Measures (our deep-dive on ICSEA methodology)


