
Every address in Australia sits somewhere on a bushfire risk spectrum, and in most states a line on a planning map decides which side of a legal threshold you are on. If the land is designated bushfire prone, new homes and many renovations must be built to a bushfire construction standard, which changes what you can build and what it costs. Insurers, meanwhile, price bushfire exposure into premiums address by address.
Buyers on the urban fringe often discover all of this late: at the building permit stage, at the first insurance quote, or in the fine print of a due diligence checklist after the deposit is paid. The information was public the whole time. So how do you actually check it before you commit to a property?
The short version
| Official state maps | Local fire authority | BAL assessment | Modelled score | |
|---|---|---|---|---|
| Cost | Free | Free | Hundreds to low thousands | Free |
| What you get | In-or-out designation | Local knowledge and context | Formal BAL rating under AS 3959 | 0-100 score plus an indicative BAL pre-screen, from overlays + vegetation + slope |
| Covers | All states + ACT (not NT) | Your district | One site at a time | Every address |
| Best for | Confirming designation | Colour before an offer | Building or renovating | Shortlisting and comparison |
The rest of this guide goes through each option, plus a two-minute primer on how bushfire risk actually works at a property level, so the maps and ratings mean something when you read them.
First: bushfire risk at a property, in two minutes
Fire behaviour is a big field, but for a single address it comes down to three things:
- Fuel is what burns. For a property, fuel means the vegetation around it: how much there is, what type it is, and how continuous it is between the bush and your walls. Two houses in the same street can face very different risk depending on whether the block backs onto continuous woodland or a mown reserve.
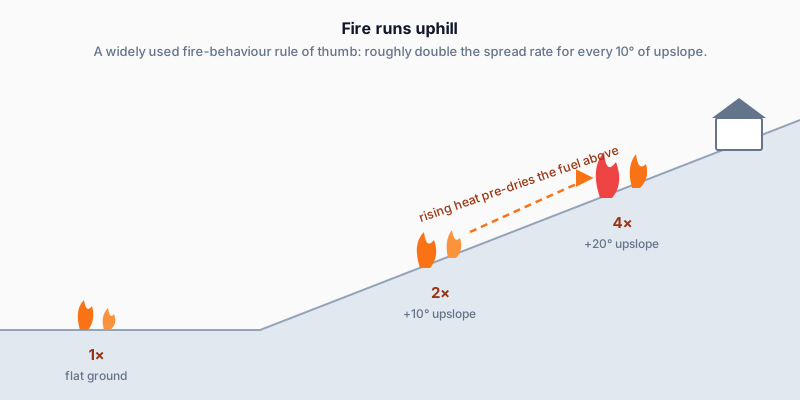
- Slope changes fire speed. Fire runs dramatically faster uphill, because the flames pre-heat the fuel above them. A widely used rule of thumb in fire behaviour training is that fire roughly doubles its speed for every 10 degrees of upslope. A house at the top of a vegetated gully and a house on flat ground can share a suburb and not much else.
- Weather supplies the trigger. Hot, dry, windy days turn the same fuel and slope into a very different fire. You cannot map next summer's weather, but fuel and slope are fixed properties of an address, which is exactly why they can be mapped and scored in advance.
The legal layer sits on top of this. Where land is designated bushfire prone on an official state map, new dwellings and many major renovations must generally be assessed and built to AS 3959, the Australian Standard for construction in bushfire-prone areas. That assessment produces a Bushfire Attack Level, or BAL: a scale that runs from BAL-LOW through BAL-12.5, BAL-19, BAL-29 and BAL-40 up to BAL-FZ (Flame Zone). Higher ratings mean higher expected radiant heat and ember exposure, and progressively stricter construction requirements, from sealed gaps and ember guards at the low end to specialised construction at the top. The BAL number drives real money: windows, decks, cladding and vents all change specification as the rating climbs.
What counts as "bushfire prone"?
Each state keeps its own official bushfire mapping: bushfire prone land maps, bushfire management overlays, or bushfire hazard overlays depending on the jurisdiction. These maps are the legal instrument. If your lot is inside the mapped area, the planning and building system treats it as bushfire prone, and the construction requirements above follow.
Two things are worth being clear-eyed about:
- A designation is a planning consequence, not a prediction. Being mapped bushfire prone does not mean a fire is coming, and being outside the map does not mean one is not. The maps exist to decide where stricter building rules apply.
- Overlays age. Official bushfire mapping is typically updated on multi-year cycles, while vegetation grows, gets cleared and burns on much shorter ones. The map tells you the designation; it does not tell you what is actually growing next door this year, or which way the hill runs.
With that context, here are your options.
Option 1: Official state bushfire prone land maps (free, the legal answer)
Every state and territory except the NT publishes bushfire prone area mapping you can check: Victoria, NSW, Queensland, Western Australia, South Australia, Tasmania and the ACT. If you want the authoritative in-or-out answer for a specific lot, this is it, because it is the same map the building system uses.
The catch: the maps answer exactly one question, in or out, per state, in seven different portals with seven different interfaces. They do not tell you how much fuel actually surrounds the address, whether the block sits above a vegetated slope, or how one shortlisted property compares with another. And because they update on multi-year cycles, the boundary can lag what is on the ground: Queensland's current statewide dataset, for example, dates from 2017.
Option 2: Talk to the local fire authority (free, local knowledge)
Your state's fire service (the CFA in Victoria, the RFS in NSW, DFES in WA, and so on) knows its districts. Local brigades can often tell you how fire behaves in the area, what the access and egress issues are, and whether community fire planning exists for the street. Some run community programs specifically for residents in higher risk areas.
The catch: this is qualitative, it varies by brigade and by who picks up the phone, and it is not something you can do for twenty shortlisted addresses. Treat it as colour for a property you are serious about, not a screening tool.
Option 3: A BAL assessment by an accredited assessor (the formal tool when building)
If you are building, extending or doing major renovations on designated land, an accredited bushfire assessor visits the site and applies the AS 3959 method: vegetation classification, distance to the hazard, and effective slope, producing the formal BAL rating your building surveyor and council will work from. Costs vary with site complexity, but typically run from a few hundred dollars to low thousands.
This is the gold standard for construction decisions, and nothing modelled replaces it. If your project needs a BAL, you will be commissioning one regardless.
The catch: it is per site, it costs real money, and it answers a construction question, not a purchase question. Nobody commissions a BAL assessment for every house on a shortlist.
Option 4: A free modelled bushfire score (instant, every address)
This is what we built at DA Leads: a free bushfire exposure score for any address in Australia. Type an address, get a 0-100 score, where 100 is the lowest risk, plus the components behind it, so you can see why the number is what it is.
The score combines three independent signals:
- Official bushfire-prone overlays. We check official bushfire-prone mapping in every state and territory except the NT: Victoria, NSW, Queensland, WA, SA, Tasmania and the ACT. For most of those states the check runs against our own full copy of the state's published overlay dataset rather than a call to the state service at that moment, and every response says which basis answered. A designation drives assessment requirements and construction standards, so it anchors the score.
- Real vegetation fuel from satellite. From ESA WorldCover, a 10-metre resolution global satellite land cover product, we measure the actual vegetation around the address: tree cover, shrub and grassland, and how continuous it is. Not a building-density proxy, the real land surface. That distinction matters most on the urban fringe, where the risk is highest.
- Terrain slope from elevation data. Fire runs uphill, so we sample laser-surveyed bare-earth elevation (national terrain model outside LiDAR coverage) in a ring around the address and derive the local slope, which raises or lowers the score.
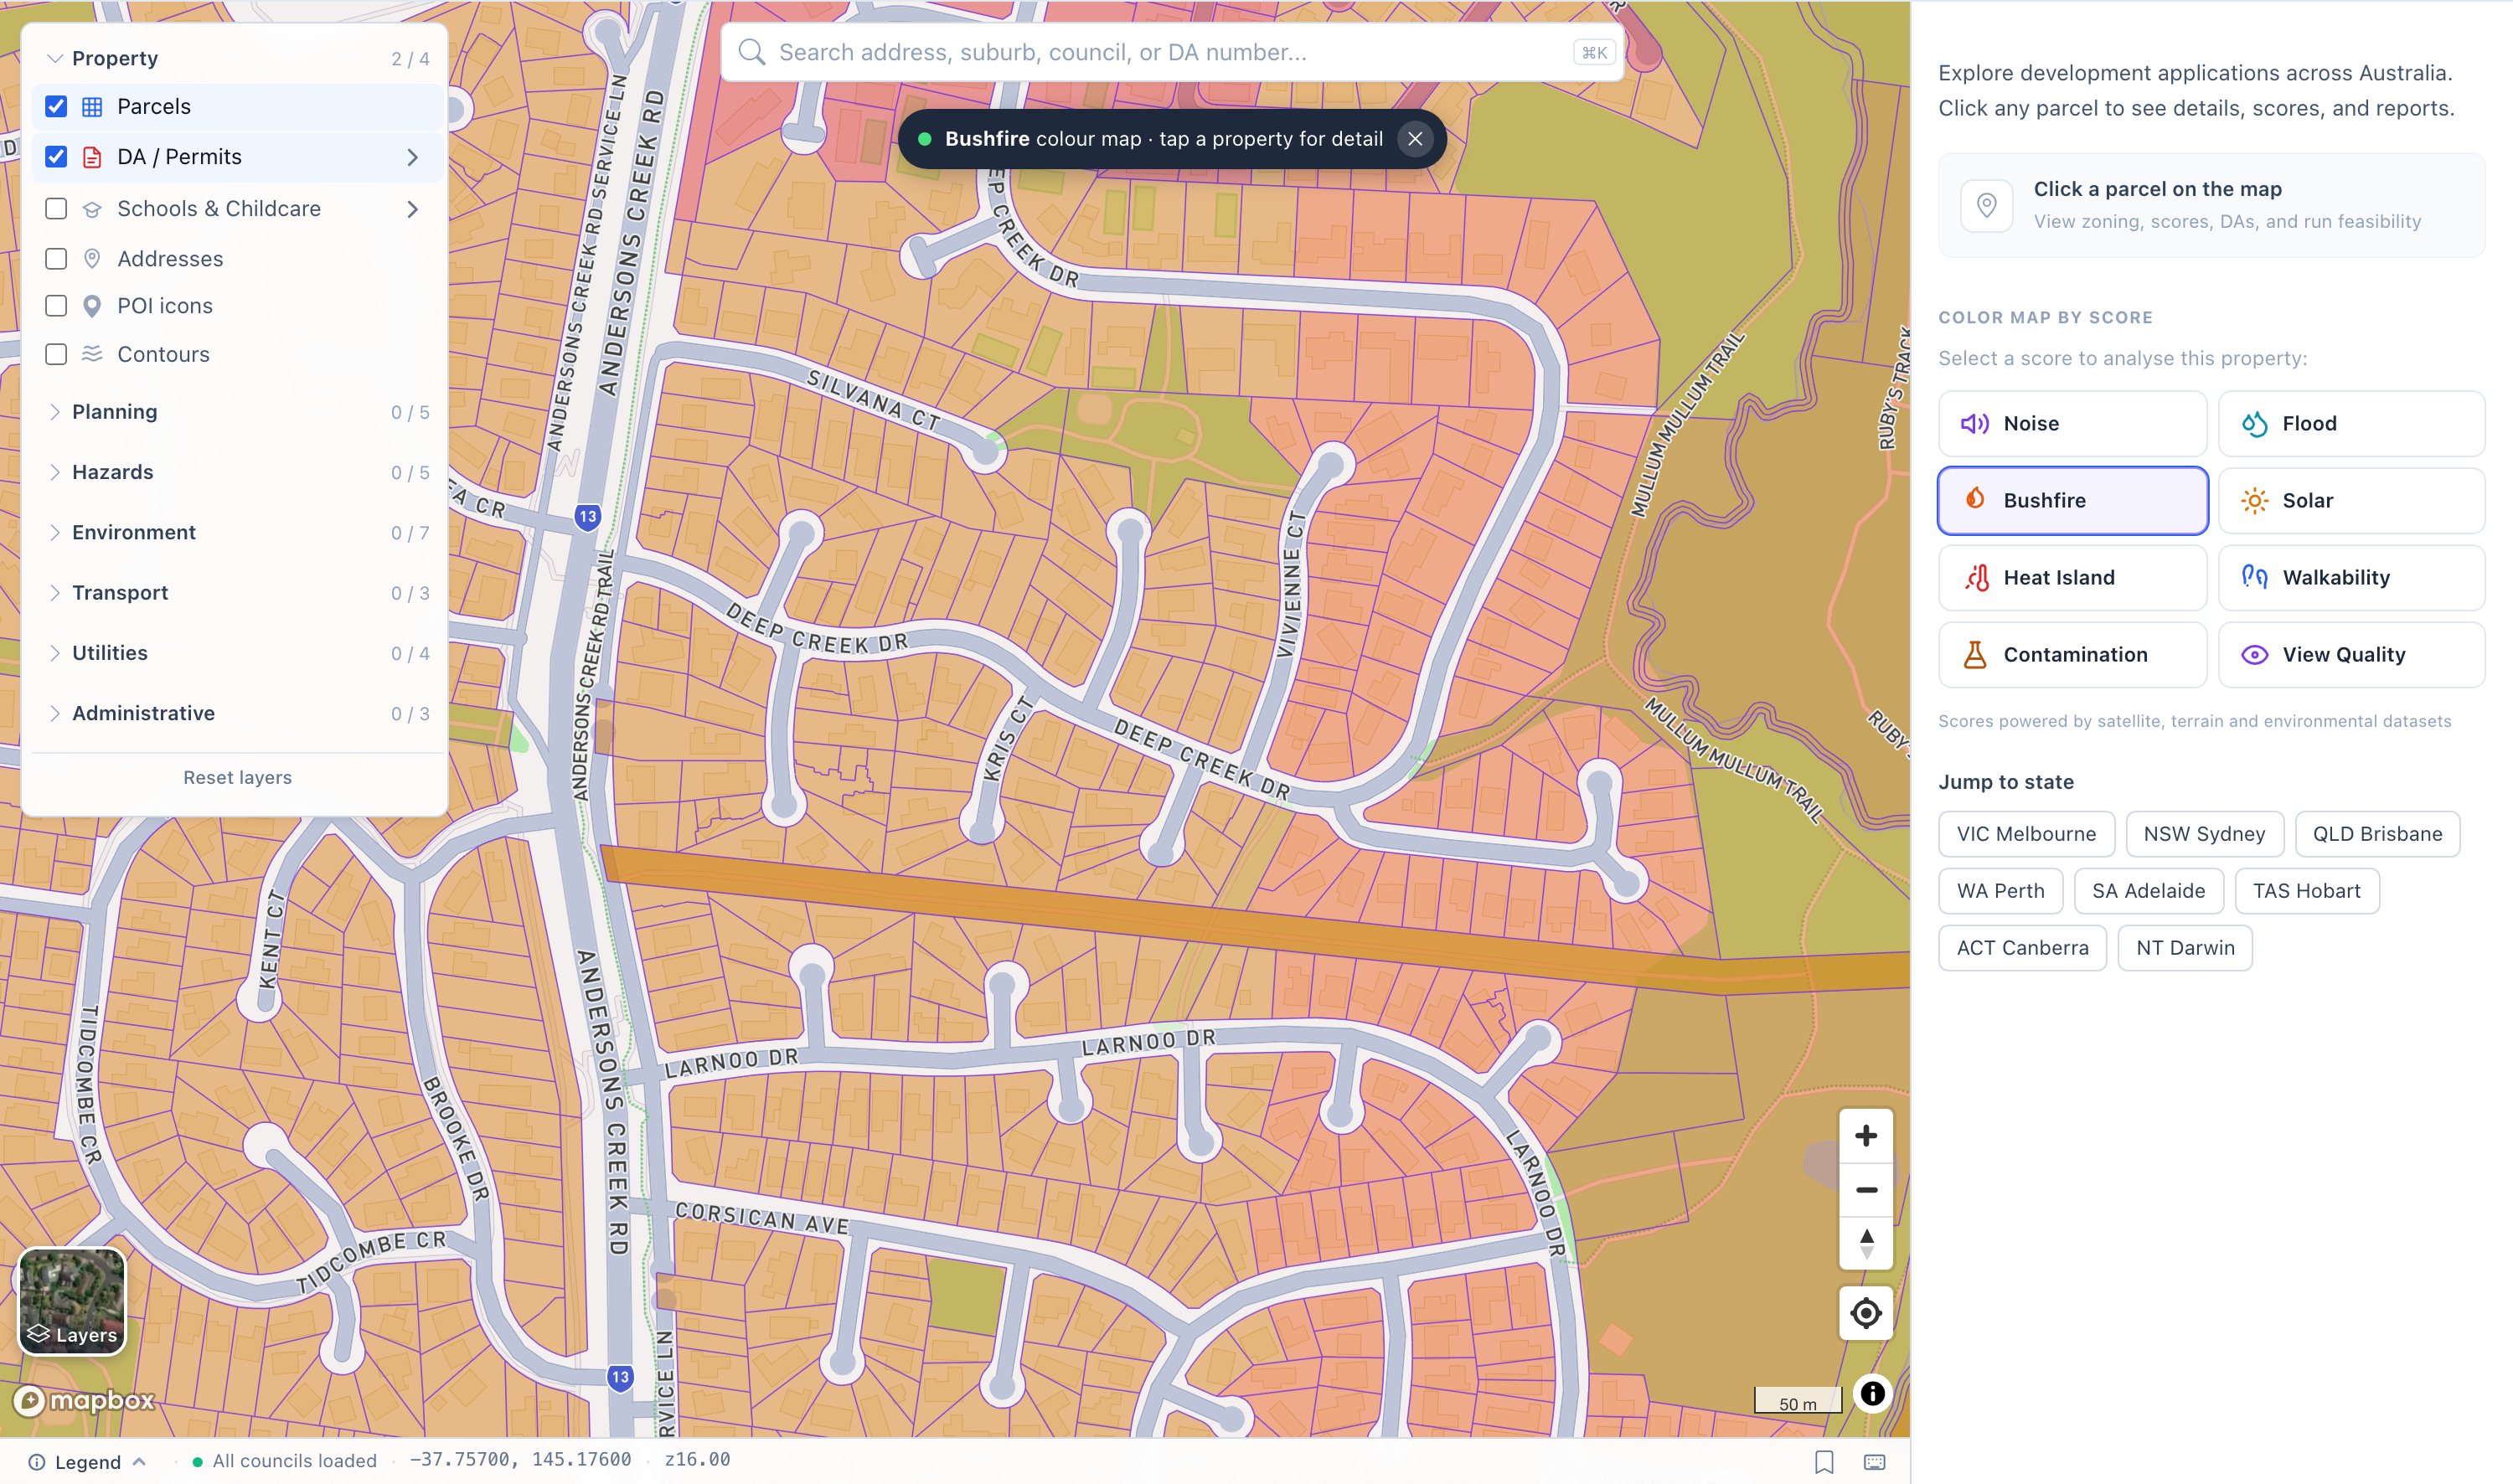
The bushfire colour map on our map: parcels coloured by score at the urban fringe, with risk climbing towards the bush reserve on the right.
The bands are straightforward: 80 and above reads Very Low Risk, 60 to 79 Low Risk, 40 to 59 Moderate Risk, 20 to 39 High Risk, and below 20 Very High Risk. A typical fringe example: a score of 55 reads as Moderate Risk, driven by vegetation within 300 metres of the address on a gentle slope.
Watching the fuel around an address, as fire
Since July 2026 the map leads with the answer people actually act on. Open an address in the map's bushfire mode and the panel now headlines an indicative Bushfire Attack Level (BAL-LOW through BAL-FZ) in plain English, worked out from the same AS 3959 inputs an assessor uses, with a confidence range and the 0-100 risk score kept as a supporting detail. The burnable land cover (tree cover, shrub, grass) carries a warm ember tint that slowly breathes, its warmth tied to the score, so the bush around a High Risk address visibly glows while a Very Low Risk one stays green. Dark greens are tree cover, yellows are shrub and grass, grey is built-up land that carries little fuel; a dashed ring marks the 500-metre radius the score actually measures, and the fuel backdrop extends well beyond it for context. Every result carries a one-line verdict in plain English, including whether fire has actually burned in the area in the last 30 seasons and when. To be clear about what the animation is: it visualises fuel exposure around the address, scaled to the score. It is not a fire-spread prediction: the glow is deliberately directionless, because any directional animation would read as "the fire comes from over there", which no open-data model can honestly claim. The panel says so, and the same glow runs in the demo on the score page.
Indicative, not certified. The BAL the map shows is a pre-screen: it uses the AS 3959 Method 1 approach an assessor uses, but it reads vegetation, distance and slope from open satellite and terrain data rather than a site visit, so it comes with a confidence range and is built for comparing and shortlisting addresses. It is not a certified BAL. A certified rating is produced by an accredited assessor on site under the national standard, and it is what your building surveyor and council work from. If you are building on designated land, you need Option 3 regardless of what any model says.
Honest limits
A bushfire score that silently treats missing data as safety is worse than no score, so every component of ours reports whether it was measured or not assessed:
- The NT publishes no bushfire-prone overlay we can query, so NT scores rely on the vegetation and slope signals and say so, rather than pretending the overlay was checked. Queensland's official layer is a 2017-vintage dataset.
- Slope cannot be measured outside elevation coverage. Where that happens, the response says
not_assessedexplicitly instead of quietly assuming flat ground. - Vegetation is real land cover, not a fire-behaviour simulation. We measure what is actually growing around the address from satellite, but we do not model weather, ember attack or fire spread. That is what fire agencies and formal assessments are for.
- No score predicts a fire. Ours ranks exposure so you can compare addresses; it says nothing about whether or when a fire will occur.
Which option should you use?
- Shortlisting suburbs or comparing addresses: the free modelled score, which puts overlay designation, actual vegetation and slope on one scale for every address. Follow up on the official state map for anything you get serious about.
- Before making an offer on a fringe or regional property: the official state map for the legal designation, plus a conversation with the local fire authority for context the maps cannot give you.
- Building, extending or renovating on designated land: an accredited BAL assessor. Bring the modelled picture as a starting map, not a substitute.
FAQ
How do I know if my property is bushfire prone? Check your state's official bushfire prone land map; every state and territory except the NT publishes one. Our free bushfire score checks those same official designations where they are available, alongside actual vegetation and slope, so it is a fast first check across all states.
What is a BAL rating? A Bushfire Attack Level under AS 3959, the Australian Standard for construction in bushfire-prone areas. The scale runs BAL-LOW, BAL-12.5, BAL-19, BAL-29, BAL-40 and BAL-FZ, with higher ratings meaning higher expected heat and ember exposure and stricter construction requirements. It is produced by a formal site assessment, usually by an accredited assessor.
Does bushfire zoning affect insurance? Insurers price bushfire exposure using their own risk models rather than the planning designation directly, but the underlying drivers overlap heavily, so addresses in higher risk areas generally pay more for cover, and in some cases cover is harder to obtain. Get quotes before you buy, not after.
Is the DA Leads bushfire score a BAL rating? No. It is a free modelled 0-100 estimate built from official overlay queries, 10-metre satellite vegetation and bare-earth terrain slope, designed for comparing addresses. A BAL rating is a formal construction rating from an on-site assessment, and only that satisfies building requirements.
Where does the score's vegetation data come from? ESA WorldCover, a 10-metre resolution global satellite land cover product. We measure tree, shrub and grass cover around the address directly rather than inferring fuel from building density.
Does the score check the official map in every state? In every state and territory except the NT, yes. For most of those states the check runs against our own copy of the state's published overlay dataset rather than a call to the state service at that moment, and the response says which basis answered. The NT publishes no bushfire-prone overlay we can access, so NT scores rely on the vegetation and slope signals and say so explicitly instead of scoring as if the overlay were clear. Queensland's official layer is a 2017-vintage dataset.
Check any address free on the map, or read the full methodology and honest limitations on the bushfire score page.


