Every address in Australia has a noise profile. Most people discover theirs after they move in: the arterial road you didn't notice on a quiet Saturday inspection, the train line behind the tree screen, the flight path that only runs on weekdays.
Noise is one of the few property problems you cannot renovate away, and it prices in. Academic meta-analyses put the impact of traffic noise at roughly 0.5 to 2 percent of property value per decibel, depending on the market. So how do you actually check it before signing a contract?
The short version
| DIY (visits + apps) | Official maps | Paid report | Acoustic consultant | Modelled score | |
|---|---|---|---|---|---|
| Cost | Free | Free | ~$60 | $2,000+ | Free |
| What you get | A few moments in time | Aircraft + project corridors only | 1-5 scale rating | Defensible measurement | Annual dB estimate, per facade |
| Covers | Wherever you stand | Narrow slices | Per address | Per site | Every address |
| Best for | Final gut check | Flight path checks | Second opinion | DA / legal | Shortlisting + comparison |
The rest of this guide goes through each, plus a two-minute primer on how noise is measured so the numbers actually mean something.
First: how noise is measured, in two minutes
A few basics make every noise number easier to judge:
- Decibels are logarithmic. An increase of 10 dB is roughly twice as loud to human ears, and 3 dB is a doubling of sound energy that most people barely notice. The gap between a 47 dB bush street and a 73 dB inner-city street is not "26 percent worse", it is several times louder.
- dB(A) weights the measurement to human hearing, discounting the very low and very high frequencies we barely perceive. Almost every figure you see quoted, including ours, is A-weighted.
- Lden is the annual average that regulators use. It combines day, evening and night levels across a whole year, with penalties added to evening (+5 dB) and night (+10 dB) noise because the same sound is more annoying when you're trying to sleep. A single reading on a Tuesday is not comparable to an Lden figure.
- Everyday anchors: a quiet bedroom sits around 30 dB, a library 40, a quiet suburban street 45 to 50, conversation 60, a busy road up close 70+, heavy traffic at the kerb 80+.
- Geometry matters more than intuition suggests. A road is a line source, so noise falls off slowly, only about 3 dB per doubling of distance. What actually protects a home is what stands in between: solid buildings and terrain can screen 5 to 10+ dB, which is why two houses on the same street can have very different noise exposure.

What counts as "too noisy"?
The World Health Organization's 2018 environmental noise guidelines recommend keeping road traffic noise below 53 dB Lden, and below 45 dB Lnight for sleep protection. Plenty of perfectly liveable urban addresses sit above those lines, but they are a useful, evidence-based yardstick: above them, health effects like sleep disturbance and annoyance start climbing measurably.
Planning systems care too. NSW, for example, publishes a guideline for development near rail corridors and busy roads, and residential development in those corridors can trigger a mandatory acoustic assessment and construction requirements. If you're building rather than buying, noise can be a compliance item, not just a comfort one.
Option 1: Visit at different times (free, do it anyway)
Inspect on a weekday morning, come back at peak hour, stand in the backyard and listen. Nothing replaces your own ears at the address.
The catch: you can't camp there at 5am when the trucks start, or on the Friday night the pub loads out. One or two visits sample a handful of moments from a noise environment that varies by hour, day and season. And by inspection time you've usually shortlisted three properties, not thirty.
Option 2: Phone sound meter apps (free, misleading)
Sound level apps measure something, but uncalibrated phone microphones commonly read several dB off, and they only capture the moment you're standing there. Remember the primer: a spot reading is not an annual average, and the annual average is what determines whether a place wears you down.
The catch: the number looks scientific and isn't. Fine for comparing two spots in the same hour, not for a purchase decision.
Option 3: The official noise maps that exist (free, narrow)
Australia has no national noise map. Unlike the EU, where the Environmental Noise Directive requires member states to publish measured noise maps of their cities, no Australian government publishes a general one. What does exist officially:
- Aircraft: ANEF contours and WebTrak. Every major airport publishes Australian Noise Exposure Forecast contours (the ones planning law uses via AS 2021), defence airfields publish theirs on data.gov.au, and Airservices Australia's WebTrak lets you replay actual flight tracks over any address. If your worry is aircraft, these are authoritative and free.
- Project corridors. Major road and rail projects publish noise assessments and sometimes ongoing monitoring. NorthConnex in Sydney, for example, publishes professional-grade monitoring results, which is exactly the measured data we later used to calibrate our own model.
The catch: aircraft and a handful of project corridors. For the road and rail noise that dominates most addresses, there is no official map to check.
Option 4: Paid noise reports and commercial noise maps
A small commercial market fills part of the gap. At the consumer end, services like NoiseNet sell per-address noise risk reports, typically around $60 for a rating on a 1-to-5 scale. At the enterprise end, commercial per-building noise datasets exist, built with professional acoustic simulation software and distributed through industry and research platforms; that data feeds products like automated valuation models, at enterprise price points.
The catch: the consumer reports give you a coarse band rather than decibels, and the enterprise datasets are not something an individual buyer can practically access.
Option 5: Professional acoustic assessment ($2,000+, the legal gold standard)
A qualified acoustic consultant with Class 1 equipment will measure your specific site over a proper duration, typically accurate within 2 to 3 dB, and produce a report that stands up in planning and legal contexts. If you're lodging a DA near a rail corridor, designing glazing, or in a dispute, this is the tool, and nothing modelled replaces it.
The catch: it costs thousands and takes days. Nobody commissions one per shortlisted house.
Option 6: A free modelled noise score (instant, every address)
This is what we built at DA Leads: a free noise estimate for any address in Australia. Type an address, get an annual-average Lden estimate, a 0-100 score, and a breakdown of where the noise comes from.
Be clear about what the number is: an outdoor annual-average level at the building, the same convention the European noise maps and the WHO guidelines use. Indoors is quieter, and by how much depends on your construction: closed standard windows typically cut roughly 20 to 25 dB, an open window closer to 10 to 15. So a 60 dB facade can still mean a 35 to 40 dB bedroom with the windows shut, and the same facade with windows open on a summer night is a very different experience. That is also why the per-facade breakdown matters: you can sleep on the quiet side of a noisy address.
How it works, roughly
The model starts from the noise sources around an address: the road network, train and tram lines with their real timetable frequencies, and the same ANEF aircraft contours the planning system uses. Then it measures the local geometry: distances, the buildings standing between you and each source (screening), and terrain.
The propagation itself, how much noise actually arrives at each facade given all that geometry, is learned from the measured national noise maps of the Netherlands and the UK: hundreds of millions of receptor points of government-published ground truth from the EU noise mapping regime. There is a certain irony in that: Australia publishes no such map, so we trained on the countries that do, transferred the physics to Australian geometry, and calibrated the result against professional-grade Australian measurements.
What it looks like in practice
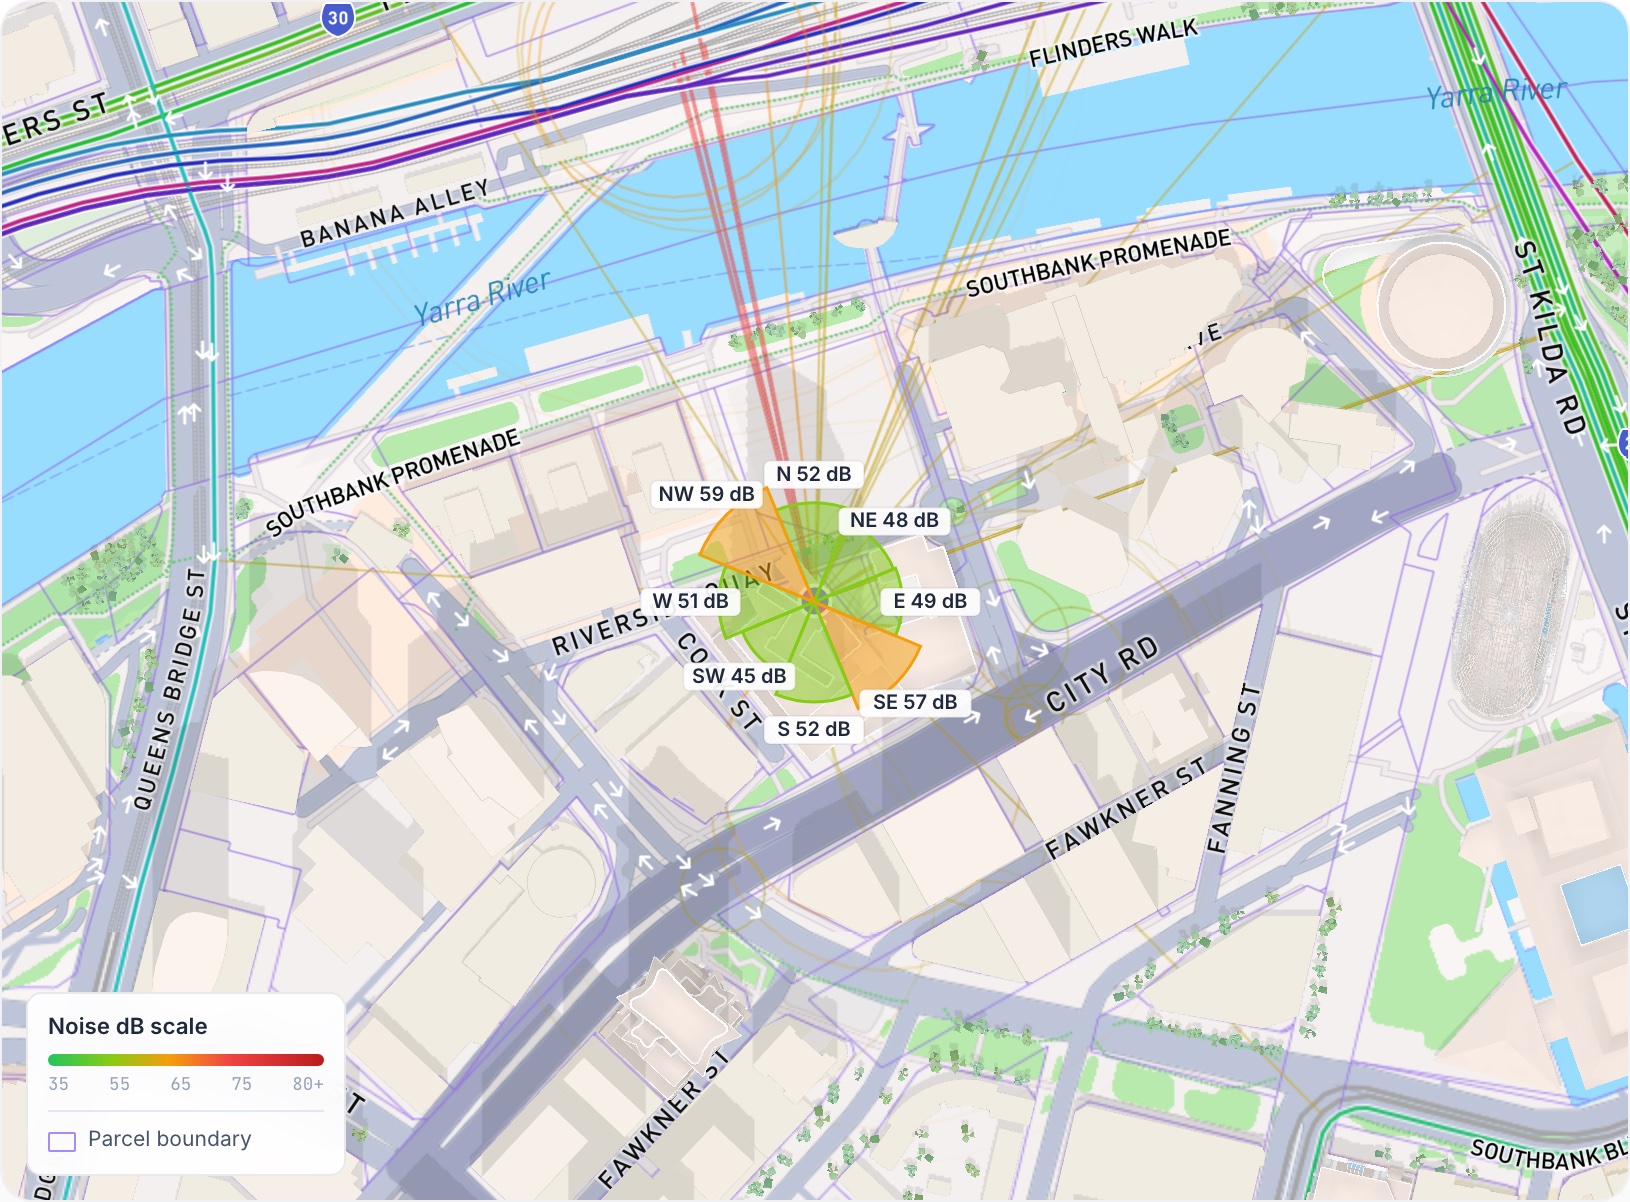
Here is the live example from our noise score page, centred on the Eureka Tower in Southbank, Melbourne:
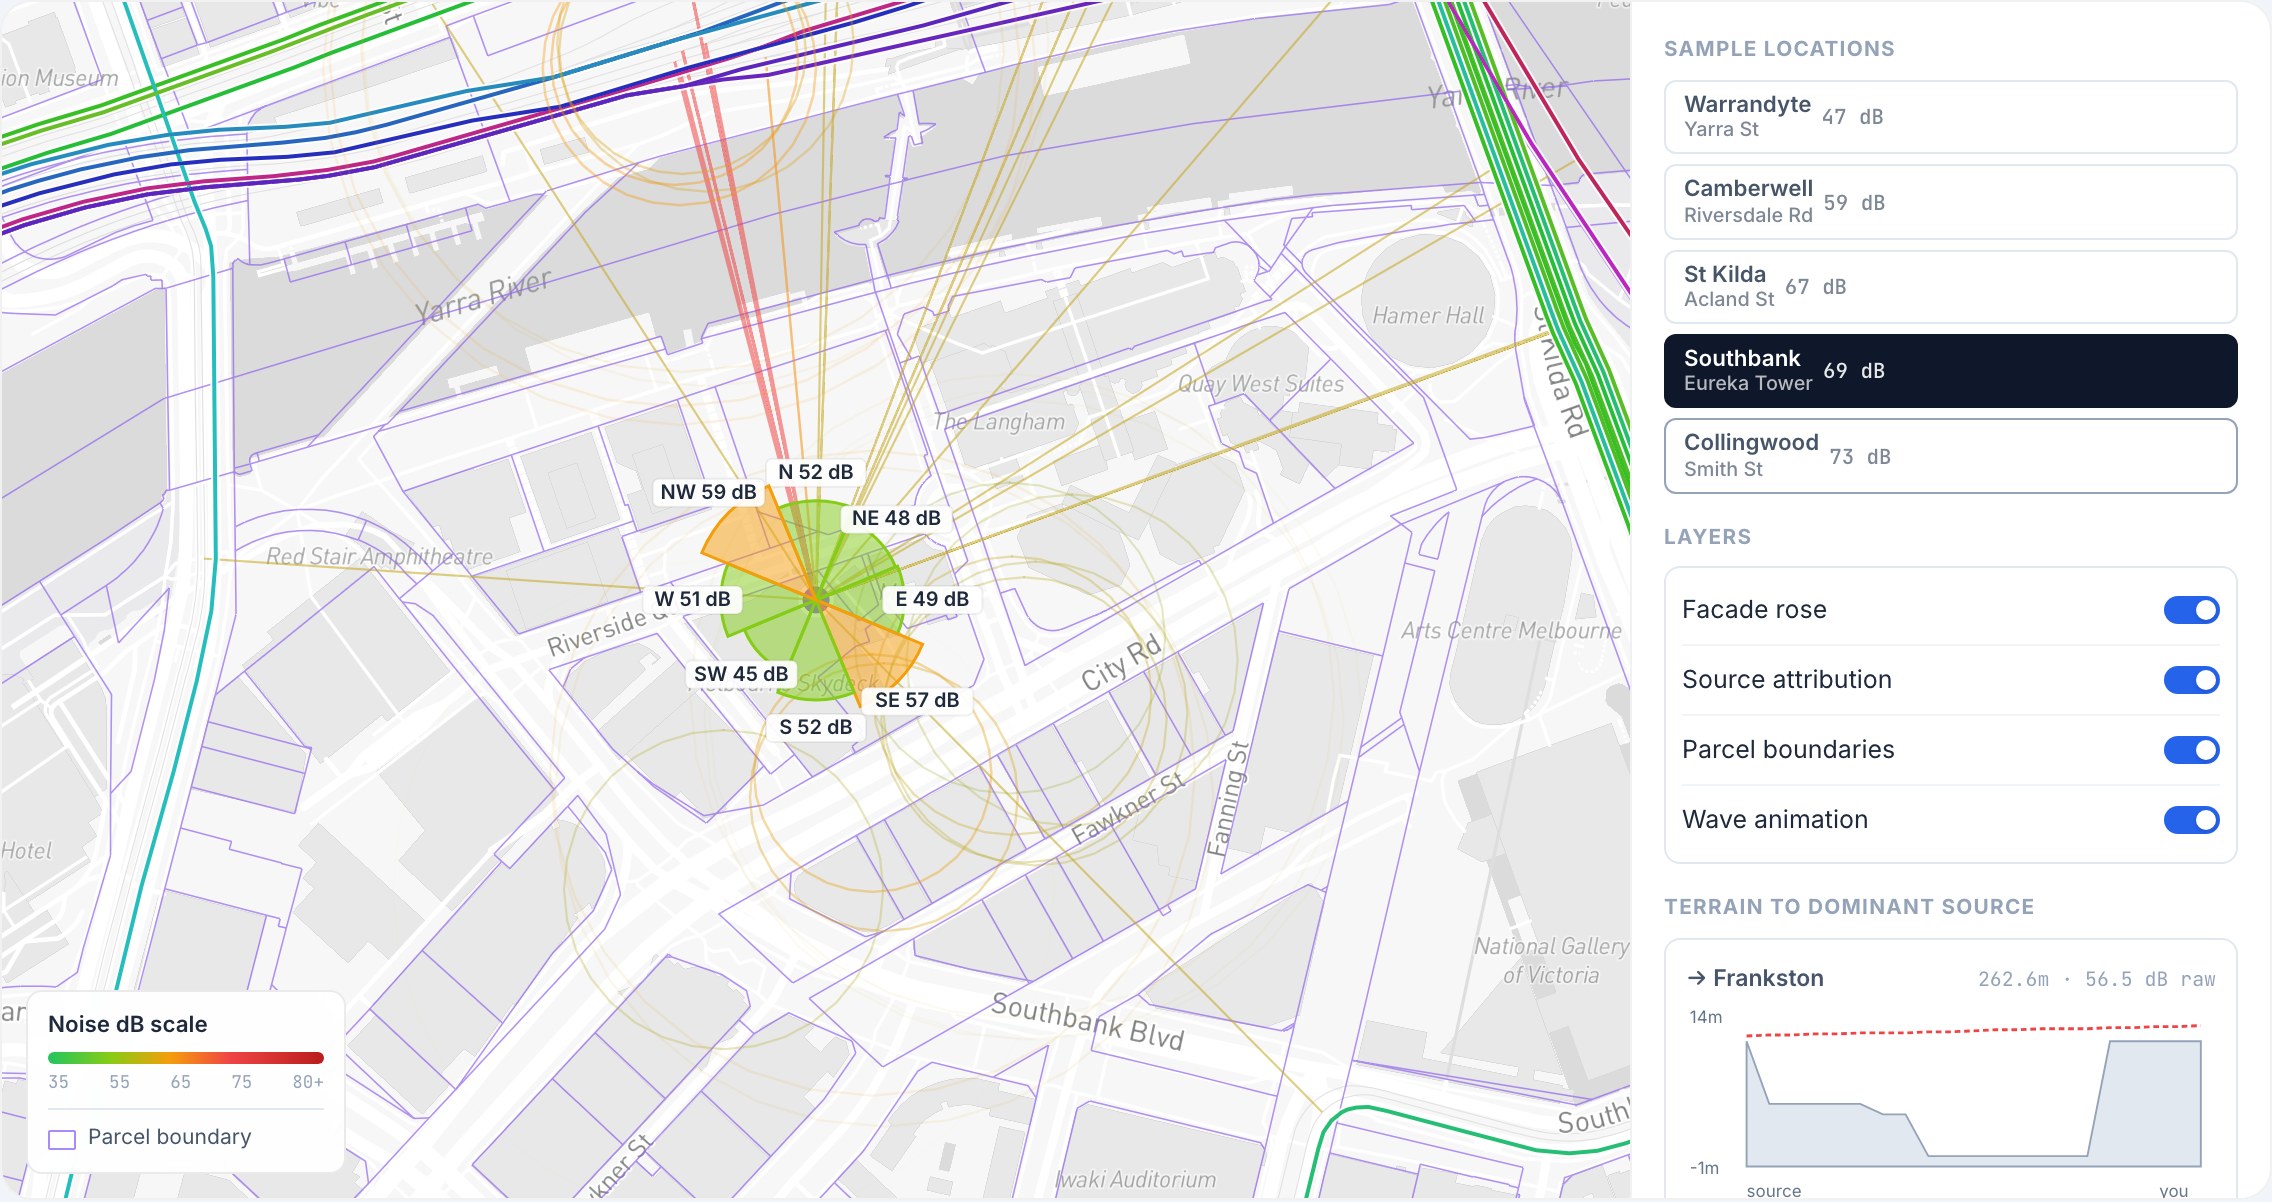
Three things worth noticing:
- The same building has quiet and loud sides. At this Southbank address the north-west facade reads 59 dB while the south-west reads 45. That is a 14 dB spread on one building, which per the primer above means the loud side is more than twice as loud. If you're choosing an apartment, the facade matters as much as the address.
- The five sample locations span real Melbourne life: a Warrandyte bush street at 47 dB, Camberwell at 59, Acland St St Kilda at 67, Southbank at 69, Smith St Collingwood at 73.
- Every score attributes its sources. The lines on the map point at the roads, rail corridors and airfields driving the number, so you can sanity-check it against what you see on the ground.
How accurate is a modelled score, really?
Fair question, and we learned the answer the hard way.
When I first posted this tool on LinkedIn, I ended with "if you spot anything off, let me know in the comments." Several of Australia's most senior acoustic engineers took the invitation seriously. One ran his own home through it and found problems. Another took actual measurements at two addresses and found a roughly 10 dB city-to-suburb difference where our model showed 1 dB. A Fellow at a major engineering firm summarised our predictions with a single cactus emoji.
They were right. We lined the model up against Class 1 measurements from the NorthConnex monitoring program, professional equipment at real residential receivers, and found quiet set-back homes were reading +10.9 dB too loud on average, while loud roadside locations were within about 1 dB all along. Two causes: the calibration had been anchored on modelled rather than measured reference data, and rail propagation was ignoring cuttings and noise barriers.
So we rebuilt the calibration around measured data:
Today the model sits at a 3.58 dB mean absolute error against professional reference data across seven Australian cities, against the 2 to 3 dB an on-site consultant achieves with instruments. The two addresses the measuring acoustician called out now read about 70 dB and 59 dB, an 11.5 dB gap in the direction he measured. And every day, the live system re-scores a fixed set of measured anchor locations so drift shows up as an alert instead of a LinkedIn comment.
What a 3.58 dB error means in practice: read scores as bands, not point values. If two addresses differ by 2 or 3 dB, treat them as a tie; that gap is inside the model's error and your ears would barely notice it anyway. A 10 dB difference is real, decisive, and roughly twice as loud. It also matters which way the remaining error leans: the residual quiet-end bias (+3.7 dB) means a genuinely quiet street may read slightly noisier than it is, not the reverse. For a buyer, that is the safe direction to be wrong in. The result is a tool precise enough to rank and shortlist addresses, and not precise enough to design your glazing, which is what Option 5 is for.
Two honest caveats we state everywhere: the quiet-end calibration is validated against NSW measurements first, so leafy Melbourne suburbs may still read a couple of dB warm until we anchor against Victorian data. And a modelled estimate never replaces an on-site assessment where the stakes are legal or structural.
Which option should you use?
- Shortlisting suburbs or comparing 20 addresses: the modelled score, plus WebTrak if you're anywhere near a flight path. Free, instant, same scale for every address.
- Final inspections: your own ears, at the worst plausible hour, informed by what the score says the dominant source is and which facade cops it.
- DA, legal, glazing or construction decisions: a professional acoustic consultant. Bring the modelled picture as a starting map, not a substitute.
FAQ
How can I check noise levels at an address before buying? Combine a free modelled noise score (instant, annual-average, per-facade) with WebTrak for flight paths and timed site visits at the hours the score says are worst. For legal or development purposes, commission a professional acoustic assessment.
Is the noise score an indoor or outdoor level? Outdoor, at the building facade, as an annual average (Lden). That is the convention European noise maps and WHO guidelines use. Indoor levels are lower and depend on construction: closed standard windows typically reduce noise by roughly 20 to 25 dB, an open window by closer to 10 to 15.
Are phone apps accurate for measuring property noise? Not for purchase decisions. Uncalibrated phone microphones drift several dB, and a spot reading captures one moment, not the annual average (Lden) that regulators and researchers use.
What dB level is considered noisy for a home? The WHO recommends keeping road traffic below 53 dB Lden and 45 dB Lnight. As real-world anchors: a bush street in Warrandyte measures around 47 dB, a busy tram street like Acland St around 67, and Smith St Collingwood around 73.
Does noise affect property value? Yes, measurably. Academic meta-analyses typically estimate traffic noise costs roughly 0.5 to 2 percent of property value per decibel, depending on the market and how quiet the baseline is.
How accurate is the DA Leads noise score? Mean absolute error of 3.58 dB against professional reference measurements across seven Australian cities, with the loud end within about 1 dB. It is calibrated against Class 1 measured data and re-checked daily against measured anchor points. It is an estimate, not an assessment.
Does the noise score include trains and aircraft? Yes. Rail and tram corridors enter with their real timetable frequencies, and aircraft noise uses the published ANEF contours for civilian airports and defence airfields, mapped to dB penalties in line with AS 2021.
Check any address free on the map, or read the full methodology, validation numbers and honest limitations on the noise score page.