Flood is the property risk that hides best. A block can look bone dry at every inspection all summer and still sit in a mapped floodway, because the event that defines it happens, on average, once in decades. Most buyers with flood exposure find out at one of two moments: when the insurance quote comes back, or when the water does.
The insurance quote is the expensive-but-recoverable version. Insurers price flood address-by-address using their own models, and for properties with real flood exposure, flood risk is commonly the single biggest driver of the premium. Buyers often discover this at insurance-quote time, after the contract is signed. By then it is not a due diligence question, it is a five-figure annual premium problem.
So how do you actually check flood risk before you sign? Here is every option, honestly.
The short version
| Council flood maps | State planning layers | Insurance quote | Flood consultant | Modelled score | |
|---|---|---|---|---|---|
| Cost | Free | Free | Free | Thousands | Free |
| What you get | Study maps and levels, where they exist | An in-or-out overlay answer | A price with a flood model baked in | Site-specific flood levels | 0-100 score + official overlay status |
| Covers | Patchy, council by council | VIC, NSW (partial), SA, TAS, ACT | Any address an insurer will quote | Per site | Every address in Australia |
| Best for | Deep dives where they exist | Confirming overlay status | Pre-contract reality check | Development and building | Shortlisting + comparison |
The rest of this guide goes through each, plus a two-minute primer on flood risk language so the maps actually mean something.
First: flood risk in two minutes
A few basics make every flood map easier to judge:
- "1-in-100-year flood" does not mean once per century. The technical term is the 1% AEP event: an Annual Exceedance Probability of 1%, meaning a 1% chance of that flood level being reached or exceeded in any given year. The odds reset every year. Over a 30-year mortgage, a 1% annual chance compounds to roughly a one-in-four chance of at least one such event. That is arithmetic, not pessimism.
- There are three different kinds of flooding, and they behave differently. Riverine flooding is a river or major creek breaking its banks, typically with hours or days of warning as water moves down the catchment. Overland flow (flash flooding) is intense local rain overwhelming drainage, arriving in minutes, and it can hit addresses nowhere near any river. Storm surge is coastal, driven by low pressure and wind pushing the sea inland. A property can be exposed to one, two or all three, and a map that covers only riverine flooding says nothing about the stormwater path through the backyard.
- Overlays show where studies were done, not where water goes. A planning flood overlay exists because a council or state commissioned a flood study for that area and adopted the result. No study, no overlay. An address outside every overlay might be genuinely safe, or might simply sit in a catchment nobody has studied. Absence of mapping is not evidence of absence of risk.
- Terrain is physics. Water flows downhill regardless of what has been mapped. How high an address sits above the nearest drainage path is a physical property of the land, and it applies everywhere, including the three states with no accessible statewide flood mapping.

What counts as "flood-prone"?
Australian planning systems use the 1% AEP event as the standard reference flood. The flood level that event produces, plus a freeboard margin, typically defines the flood planning area: the zone where development controls apply.
Being inside a flood overlay has real consequences beyond the insurance bill. It commonly triggers minimum floor levels for new construction, can require a flood risk assessment as part of a development application, and shapes what you are allowed to build at all. Victoria's Land Subject to Inundation Overlay, for example, maps the 1% AEP extent, while its Floodway Overlay marks the dangerous conveyance paths where controls are strictest. For anyone buying to develop, overlay status is a feasibility question, not a comfort question.
Option 1: Council flood maps and studies (free, patchy)
Councils commission the flood studies that everything else is built on, and some publish excellent tools. Brisbane City Council, for example, is commonly cited as having one of the best free flood mapping portals in the country, with historic events and flood types layered per address. Many councils will also provide flood level information for a specific property on request, sometimes as a formal flood information certificate.
The catch: it is completely uneven. One council publishes an interactive map with depths and historic events, the neighbouring one has a 15-year-old PDF, the next has nothing online at all. Fine for a deep dive on one property, hopeless for a shortlist.
Option 2: State planning systems (free, five states)
Above the councils, some states aggregate flood mapping into their planning portals:
- Victoria publishes its planning scheme flood overlays (Floodway Overlay, Land Subject to Inundation Overlay, Special Building Overlay for urban stormwater) through the state planning system, queryable per address.
- NSW has a flood layer in its ePlanning system, built from council flood studies that have been uploaded into the portal. Coverage is only as good as what councils have contributed, and it covers a subset of council areas, not the whole state.
- South Australia publishes flooding hazard layers through PlanSA.
- Tasmania and the ACT also publish queryable planning flood layers.
- Queensland, WA and the NT have no accessible statewide flood overlay. Queensland flood mapping lives council by council (which is why Brisbane's portal matters so much), and WA and the NT are similar: local studies exist, but there is no single statewide layer you can query.
The catch: five different systems with different semantics, and three states missing entirely. Even where the layers exist, the answer is binary: you are in the overlay or you are not. No depth, no context, no signal about the low-lying block that sits just outside a study boundary.
Option 3: An insurance quote (free, brutal, honest)
Here is the cheapest professional flood assessment you will ever get: ask an insurer to quote the address. Insurers run their own flood models covering essentially every address in the country, typically in more detail than public mapping, because their money is on the line. The premium is the model's output.
A quote that comes back several times higher than a comparable property nearby is information. A quote where flood cover is excluded or loaded is information. Get quotes before going unconditional, not after settlement.
The catch: the model is a black box. You get a number, not a map, and no explanation of whether the driver is riverine, overland flow or something else. And quotes take effort per address: a tool for the final two or three candidates, not the first thirty.
Option 4: Professional flood assessment (thousands, the gold standard)
For development, or where the stakes justify it, a civil or hydraulic engineer can produce a site-specific flood assessment: surveyed levels, modelled flood behaviour for the site, and a report that stands up in a development application or a dispute. If you are building in or near a flood planning area, this is often not optional, the planning system will require it.
The catch: it costs thousands and takes weeks, per site. Nobody commissions one to compare a shortlist.
Option 5: A free modelled flood score (instant, every address)
This is what we built at DA Leads: a free flood risk score for any address in Australia. Type an address, get a 0-100 score where 100 is the lowest risk, plus a plain statement of exactly which evidence produced it.
The score combines three independent signals:
- Official planning overlays, queried live. For Victoria, NSW, South Australia, Tasmania and the ACT, we query the state planning systems in real time. If an official flood zone covers the address, that dominates the score.
- Terrain drainage analysis. From 30m elevation data we measure how high the address sits above the nearest drainage line within 300 metres. Low height above a drainage path means water has somewhere to go: towards you. This is the physics backstop that works everywhere, including where no official mapping exists.
- Water proximity. Distance to mapped rivers, creeks and water bodies, as a final signal where official layers are silent.
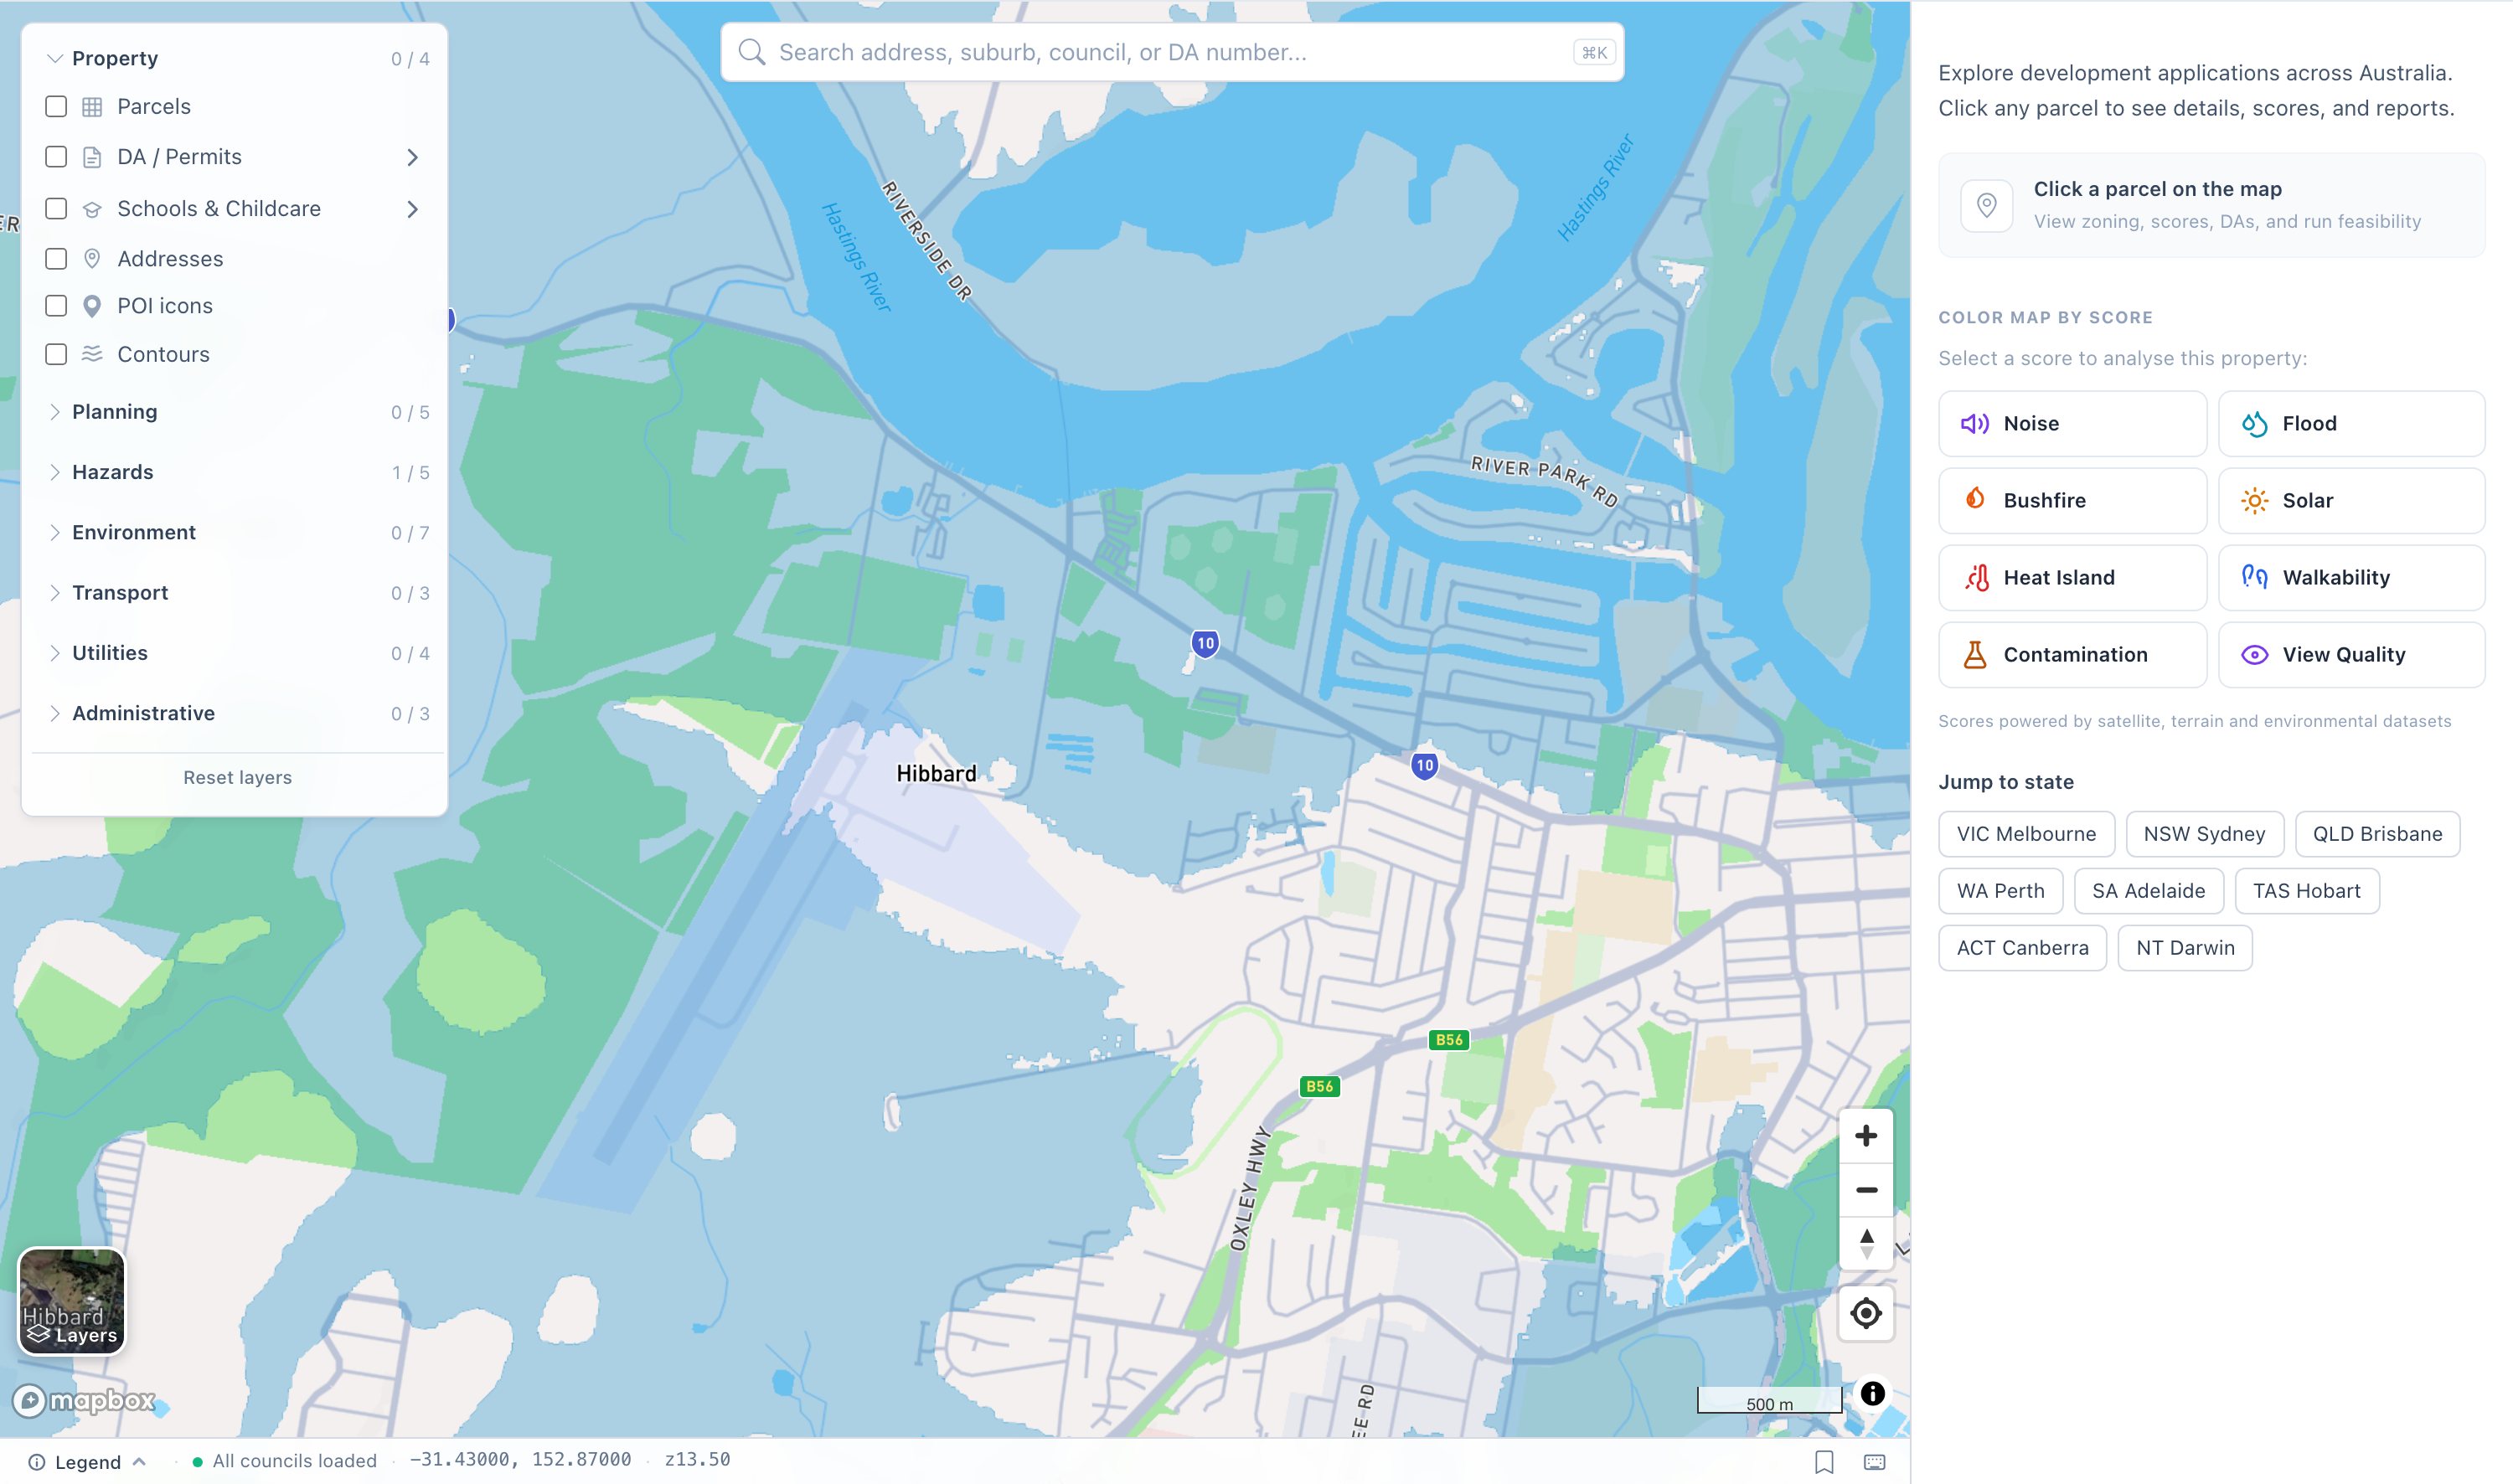
The flood layer on our map over Port Macquarie: official mapped flood extent across the Hastings floodplain, checkable for any address.
The part we are most deliberate about is provenance. Every response carries an official_layer flag with one of three values: hit (an official overlay covers this address), checked_no_hit (we queried the official layer and the address is clear), or none (no official layer exists for this state, so the score rests on terrain and proximity alone). A flood score without its provenance is dangerous, so we state it every time.
In practice, a typical clear result looks like 78, Low Risk, with the official overlay checked and not hit. Scores of 70 and above read as Low Risk, 90 and above as Very Low, with Moderate, High and Very High below that.
Be equally clear about what the score is not. It is not a hydraulic study: it produces no flood levels, no depths, no velocities. It is not a substitute for a council flood certificate, which remains the authoritative per-property document where councils issue them. And it is not an insurance prediction; insurers run their own models and will reach their own conclusions. It is a fast, consistent, free first pass that puts every address in the country on the same scale.
The honest limits
- Three states have no official layer to query. For Queensland, WA and the NT, the score is terrain and proximity only, and the
noneflag says so explicitly. We would rather flag the gap than dress terrain analysis up as government authority. - NSW coverage is partial. The ePlanning flood layer only covers the council areas that have uploaded studies. Where it is silent, the score falls back to terrain and proximity signals and is flagged accordingly.
- Overlays inherit the limits of the studies behind them. Mapping reflects where and when studies were done. A dated study, or no study, is a gap in the official record that no aggregator can fill.
- 30m terrain cannot see everything. Engineered drainage, levees and piped stormwater are below the resolution of the elevation model. A protected floodplain and an unprotected one can look similar to terrain analysis.
Which option should you use?
- Shortlisting or comparing many addresses: the free modelled score on our map. Same scale for every address in the country, official overlay status stated explicitly, instant.
- Serious about one property: the council's own flood information, plus an insurance quote before going unconditional. The quote is the second opinion that costs nothing.
- Buying to build or develop: confirm overlay status in the state planning system, then budget for a professional flood assessment if you are anywhere near a flood planning area. Bring the modelled picture as a starting map, not a substitute.
FAQ
How do I find out if my house is in a flood zone? Check the state planning portal if you are in VIC, NSW, SA, TAS or the ACT, and your council's flood mapping anywhere. Or type the address into our free flood score page, which queries the official overlays live where they exist and tells you whether one was hit.
What does a 1-in-100-year flood actually mean? A 1% chance of that flood level being reached or exceeded in any single year (the 1% AEP event). It does not mean once per century: over a 30-year mortgage, a 1% annual chance compounds to roughly a one-in-four chance of at least one such event.
Does flood zoning affect insurance? Insurers price flood address-by-address using their own models, which typically consider more than the planning overlay. But mapped flood exposure and high premiums go hand in hand. Getting a quote before you go unconditional is the cheapest flood check available.
Can a property outside every flood overlay still flood? Yes. Overlays only exist where flood studies were commissioned, and overland flow flooding regularly hits addresses no study ever covered. That is why our score also measures how high the address sits above the nearest drainage line using 30m elevation data, which catches low-lying positions that mapping never covered.
What does the official_layer flag on the DA Leads score mean? Every flood score reports whether an official planning overlay was hit, checked with no hit, or not available for that state (Queensland, WA and the NT publish no statewide layer we can access). It tells you whether the score is backed by government mapping or by terrain physics alone.
Is the DA Leads flood score free? Yes, for any address in Australia. It is a screening tool, not a hydraulic study: shortlist with it, then confirm anything decision-critical with council flood information or a professional assessment.
Check any address free on the map, or read the full methodology and honest limitations on the flood score page.