
Our development application database holds 848,471 council-lodged applications from around Australia. Filter it for solar farm applications and you get 258. The state split is the interesting part: South Australia 204, New South Wales 51, Victoria 1.
DA Leads database snapshot, queried 2026-07-12.
The single Victorian record is not even a solar farm: it is a Kew house renovation permit whose wording mentions "installation of solar energy facility". That is the entire council-visible solar universe in Victoria, and it is not a data gap. It is the approval system showing itself.
If your first question is "which council approves solar farms here", you are asking the wrong question in Victoria and only half the right one in NSW. This article covers who approves what, then the constraints that decide sites in practice, using a real 19-constraint screen of 391 hectares of Riverina farmland at Darlington Point.
Why council data shows almost no solar farms
Three planning systems produce three very different data shadows.
Victoria took solar farms away from councils. Clause 53.13 of Victorian planning schemes (Renewable energy facility) requires a planning permit for a solar energy facility, and for facilities of 1 megawatt or more the responsible authority is the Minister for Planning, not the council. A utility-scale solar farm never enters a Victorian council DA register, hence one rooftop in Kew and nothing else.
NSW splits by project cost. Electricity generating works with an estimated development cost above $30 million are State Significant Development under Schedule 1 of the State Environmental Planning Policy (Planning Systems) 2021; the threshold drops to $10 million in environmentally sensitive areas of State significance. SSD is consented by the Minister for Planning or the Independent Planning Commission. Below the threshold it is an ordinary DA to the local council, hence NSW's thin council tail of 51.
South Australia looks dominant because of how its portal works. PlanSA is a single statewide lodgement portal, so state-assessed applications land in the same public feed as council ones. SA's 204 records reflect one portal capturing nearly everything, not a market 200 times larger than Victoria's.
So a council DA register is the wrong place to measure utility-scale solar in VIC and NSW, and the right place to find the smaller projects councils really do decide.
Who approves what: the pathway table
| Victoria | New South Wales | |
|---|---|---|
| Utility-scale trigger | Installed capacity of 1 MW or more | Estimated development cost over $30 million ($10 million in environmentally sensitive areas of State significance) |
| Who decides | Minister for Planning as responsible authority | Minister for Planning or the Independent Planning Commission (SSD) |
| Instrument | Planning permit under clause 53.13 of the planning scheme | Development consent via Schedule 1 of the Planning Systems SEPP |
| Accelerated option | Development Facilitation Program (since March 2024): decisions targeted in about four months, no planning panel, no third-party VCAT review | Critical State Significant Infrastructure declaration under s 5.13 of the EP&A Act for projects deemed essential to the State |
| Below the threshold | Council is the responsible authority (under 1 MW) | Local development application to the council |
The constraints that actually decide a site
Here is how the decisive constraints landed on a real parcel: 391 hectares of irrigated cropping country on O'Neil Road, Darlington Point (Lot 161 DP821551, Murrumbidgee LGA), screened by our production engine in July 2026 as a demonstration. It is not a client project or a proposal for that land, just a real, representative Riverina parcel.
Zoning: usually workable, rarely the killer
The parcel is zoned RU1 Primary Production, rated insignificant: rural zones in both states are generally compatible with utility-scale generation, subject to consent. Zoning mostly sets the pathway rather than the outcome. The cheap first check is our free map, which shows zoning, overlays and parcels for any address.
Native vegetation and biodiversity overlays: where program risk lives
The screen's only moderate finding was a Biodiversity vegetation overlay, even though national extant-vegetation mapping (NVIS) records the footprint itself as cleared, non-native vegetation: the overlay likely captures adjacent land, not the paddocks you would build on. But an overlay is a legal trigger regardless of what the satellite says. Clearance triggers assessment and likely offsets, and the risk table puts a Phase 1 flora survey at about 8 to 10 weeks. And surveys are seasonal: miss the spring flowering window and you can wait most of a year for defensible data. Ecology rarely kills a solar site; it frequently costs one a season.
Agricultural land: the live merit fight
The parcel is visibly irrigated farmland inside an irrigation district, exactly the profile that attracts scrutiny in both states. The NSW Large-Scale Solar Energy Guideline asks applicants to consider important agricultural land, including irrigated cropping land, in site selection. Victoria's Solar Energy Facilities Design and Development Guideline plays the same role under clause 53.13. A desktop screen can tell you the land is irrigated; it cannot win the merit argument. Expect an agricultural impact assessment and community questions.
Visual amenity and neighbours: distance does most of the work
The nearest dwelling is about 898 metres away, with five dwellings within two kilometres; noise screened insignificant and visual amenity minor (moderate terrain visibility on a flat site). Solar is low-profile compared with wind, but glint and glare and landscape character still get assessed, and a dwelling at 100 metres is a different project from one at 900.
Aboriginal heritage: the honest PENDING
In NSW the Aboriginal heritage register (AHIMS) is restricted, so a desktop screen cannot clear it. Our report returns this constraint as PENDING and refuses to count it as low risk. Anyone claiming a desktop product has cleared Aboriginal heritage in NSW is overselling.
Flooding: partial mapping, partial answers
NSW council flood mapping is partial, and no mapped layer covers this site, which is not the same as the site not flooding. The screen returns a second PENDING and points to the council flood study and the 1% AEP level; on Riverina floodplain country that is a real diligence item.
Transmission: 17 metres away, and it cuts both ways
A 330 kV line (Wagga 330 to Darlington Point) runs 17 metres from the eastern boundary, and the same national infrastructure dataset lists the operational Coleambally Solar Farm in the district. That proximity is why a developer would look at this parcel at all. But a line that close almost certainly carries a registered easement with building setbacks that clip the developable area, and easement terms are only knowable from the title: order the Certificate of Title, then confirm setbacks with the network operator.
The worked example in full: 391 ha at Darlington Point
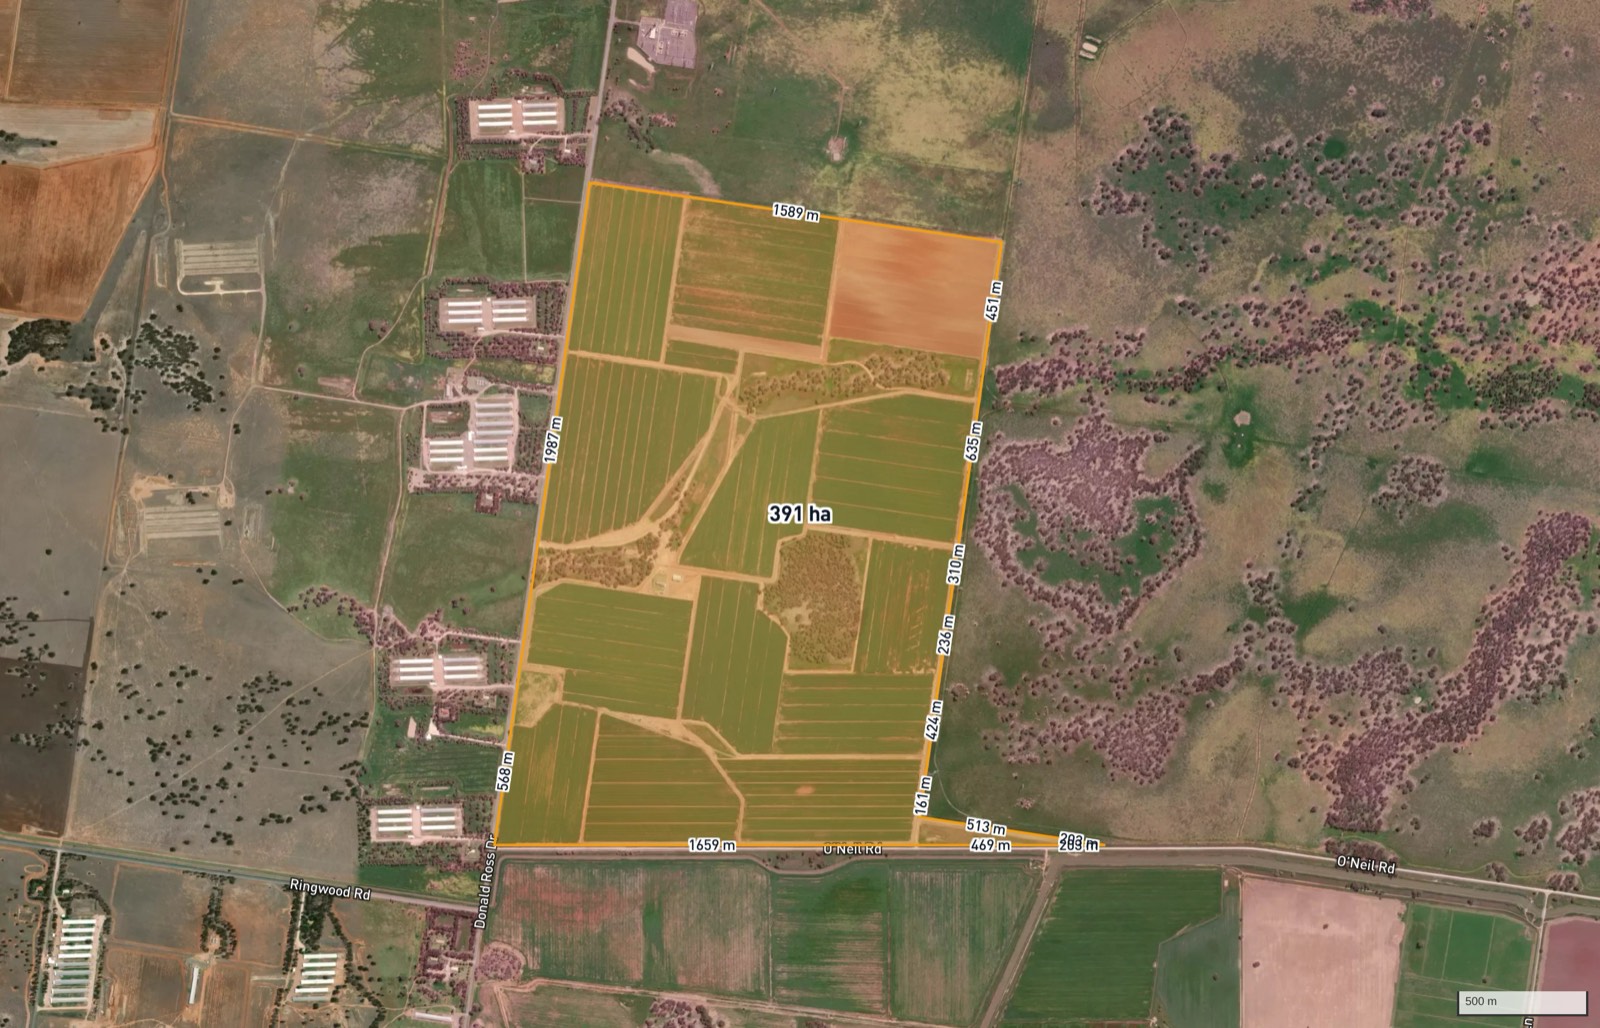 Exhibit from a screening report our engine generated on a real Darlington Point parcel as a demo. Not a client project, and not a proposal for this land.
The full 19-constraint result:
| Constraint | Rating | What the desktop screen found |
|---|---|---|
| Zoning | Insignificant | RU1 Primary Production, compatible with utility-scale infrastructure |
| Cadastral / title and easements | Minor | No mapped corridor crosses the site; nearby 330 kV line implies a registered easement; title search required |
| Planning overlays | Moderate | Biodiversity (vegetation) overlay; clearance triggers assessment and likely offsets |
| Aboriginal heritage | Pending | NSW heritage layer restricted; register search required |
| Historic / federal heritage | Insignificant | No listed place within 1 km |
| Bushfire | Insignificant | Not within a mapped bushfire prone area |
| Flora and fauna / ecology | Minor | Overlay applies, but NVIS maps the footprint as cleared, non-native vegetation |
| EPBC / national significance | Minor | Historical EPBC referral point at the site; self-assessment required |
| Hydrology / flooding | Pending | NSW council flood mapping partial; no layer covers this site |
| Noise | Insignificant | Nearest dwelling about 898 m; 5 dwellings within 2 km |
| Visual amenity | Minor | Moderate terrain visibility; partial visibility from some directions |
| Contours / topography | Insignificant | Mean slope about 0.3% |
| Geotechnical | Minor | Not desktop-assessable; intrusive investigation at detailed design |
| Soils | Insignificant | No acid sulfate or reactive soils mapped |
| Utilities (power / gas / water) | Minor | 330 kV transmission line within 17 m of the boundary |
| Traffic and access | Minor | Traffic impact and OSOM route assessments required; operational traffic low |
| Contaminated land | Insignificant | No EPA-listed site within 500 m |
| Air quality | Minor | Construction dust only; no operational emissions |
| Hazard and risk | Insignificant | No dangerous goods; glint and glare assessed under visual amenity |
The roll-up: risk score 34 out of 100 ("workable with conditions"), zero major, one moderate, eight minor, eight insignificant, two pending, with 17 of 19 constraints assessed and data completeness of 89%. The verdict is "Indeterminate: key data missing", and that is the only honest verdict available: a system that quietly treated "no data" as "no risk" would produce a greener, more saleable and less true answer.
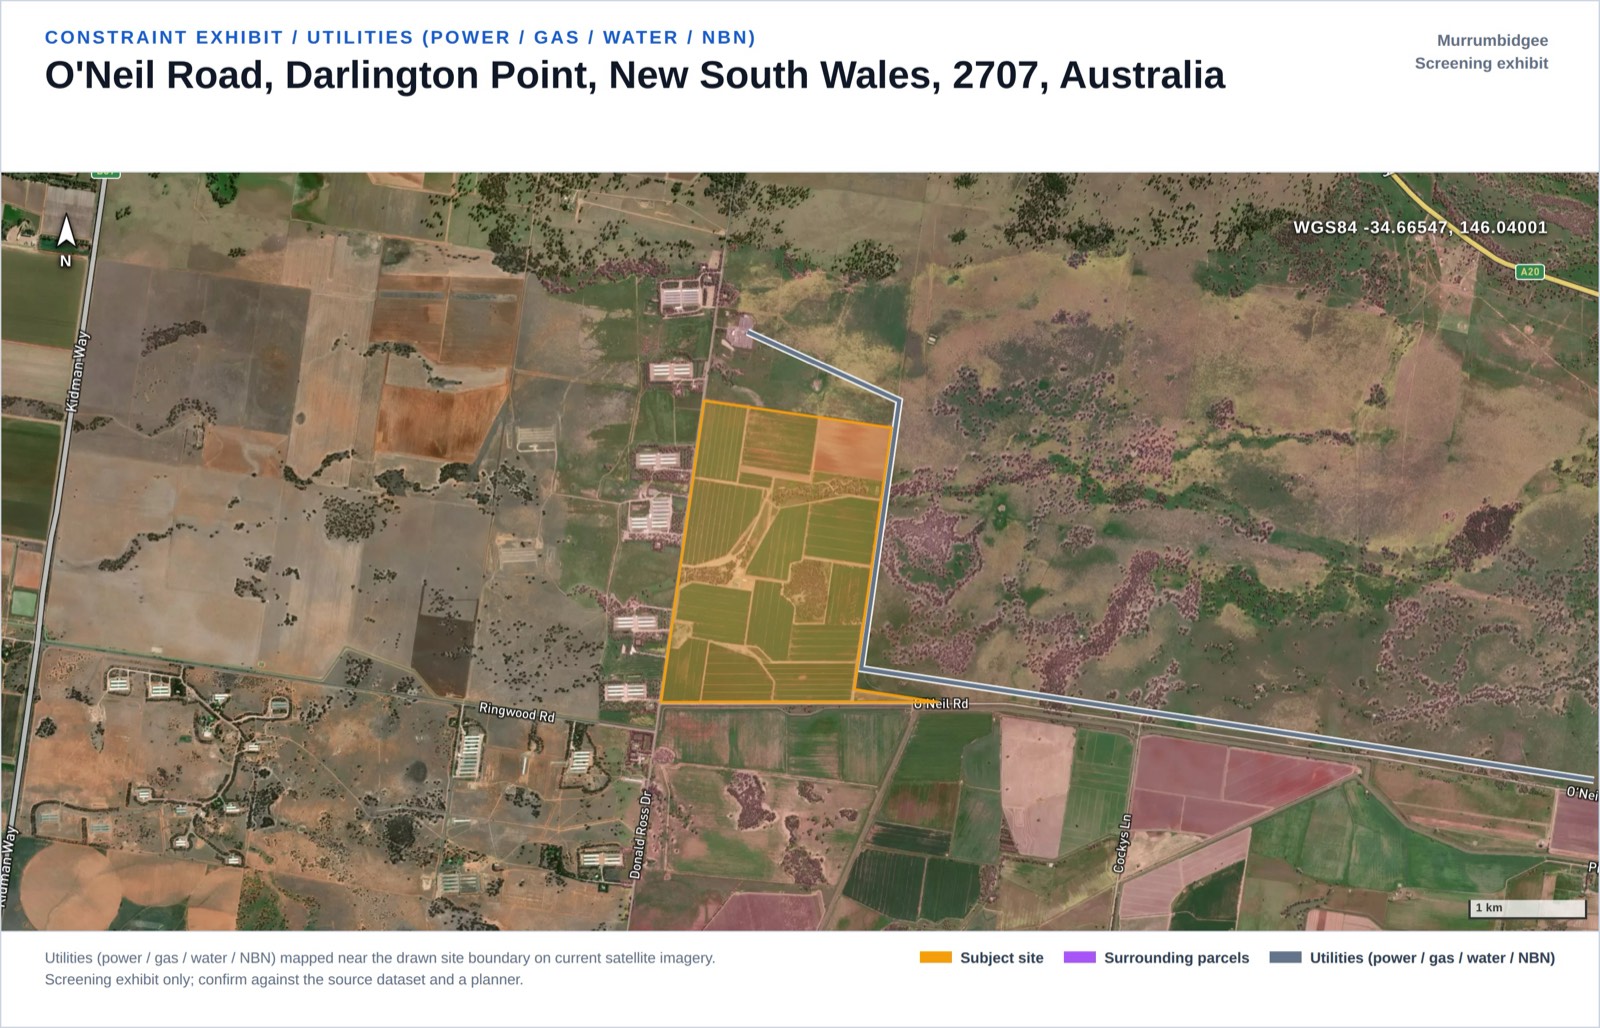 The grid exhibit from the same demo report: the 330 kV line 17 m from the boundary, connection opportunity and setback constraint at once.
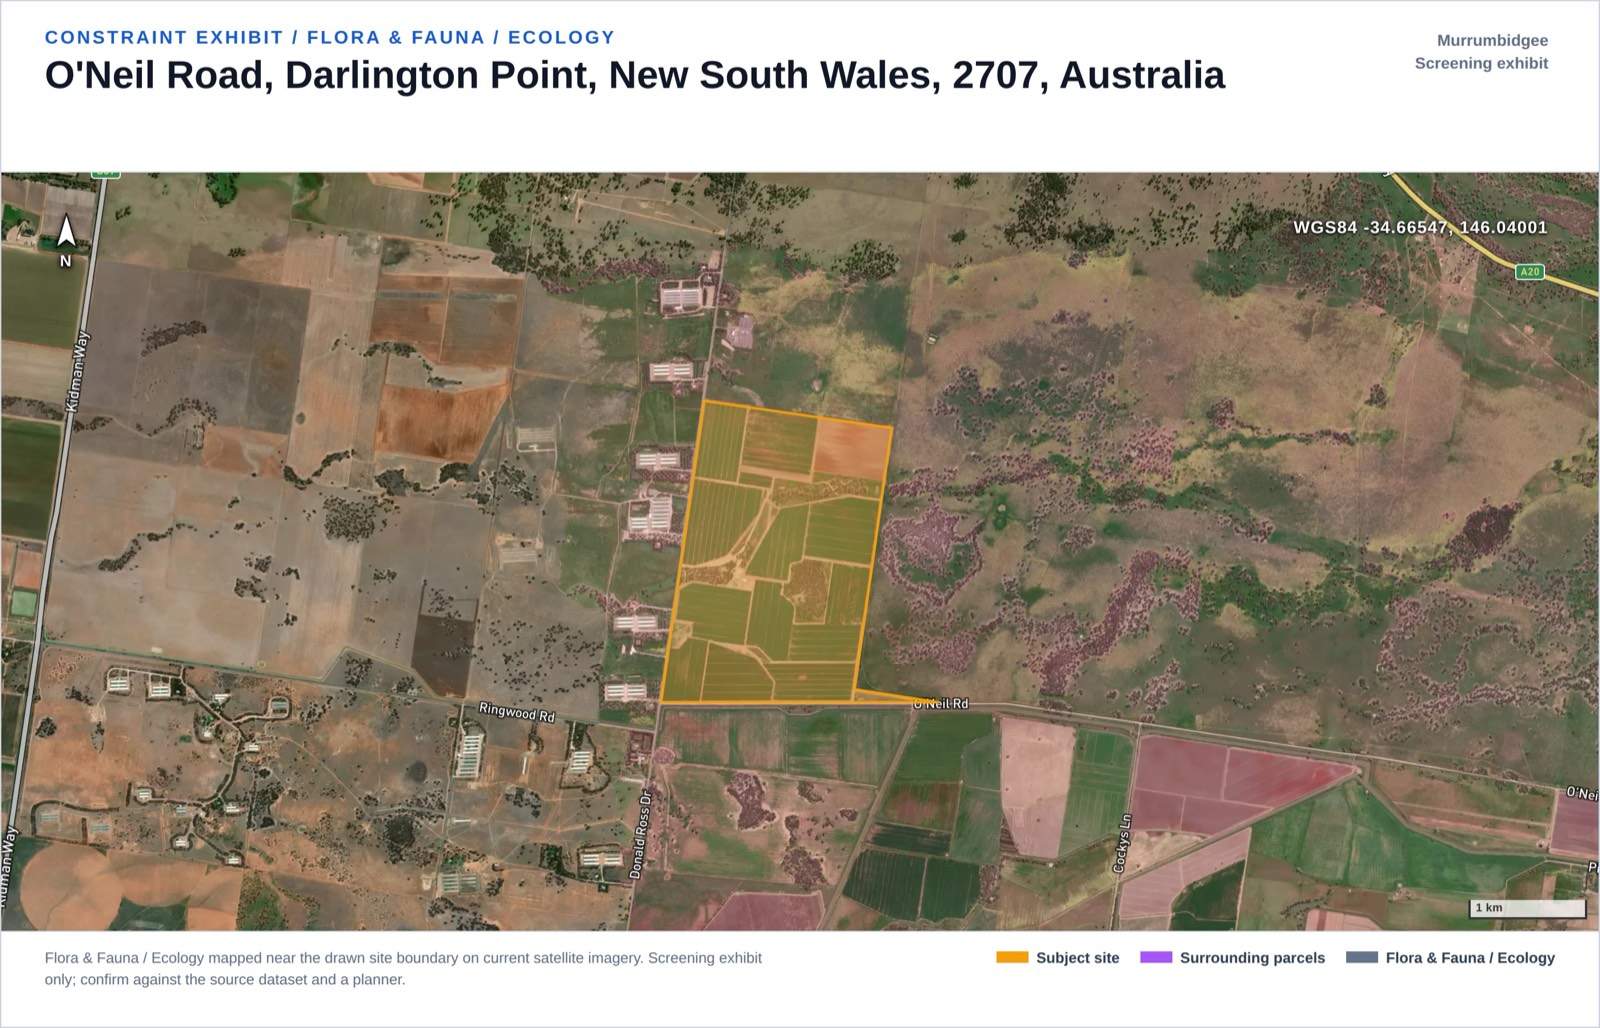 The flora exhibit: a biodiversity overlay applies while extant vegetation mapping shows the footprint as cleared cropping land.
Where council-lodged solar applications do cluster in NSW
The 51 NSW records are the useful tail. The top councils in our database for solar farm applications are Moree Plains Shire with 5, then Orange, Carrathool and Wagga Wagga with 3 each, followed by a band at 2, including Murrumbidgee, Leeton, Griffith, Bland, Murray River and Liverpool Plains.
DA Leads database snapshot, queried 2026-07-12.
This list is the small-to-mid, council-consented tail under the $30 million SSD threshold, not a league table of solar activity. It is also exactly the segment a smaller developer can pursue. From the feed: a 7.1 MW solar farm with a 5 MW battery at Hanwood, lodged with Griffith City Council in December 2025 and determined in March 2026; a 4.99 MW solar farm and battery at Walgett under assessment on the same pathway. Watch projects like these move through the system in our NSW insights and council pages.
Honest limits, and where a screen fits
A desktop screen is the first pass, not the last word. Ours queries 19 constraints from government spatial data in one business day and sorts a site into three buckets: worth consultant money, dead on arrival, or indeterminate pending specific checks. What it cannot do: read a restricted heritage register, substitute for a flood study, survey a paddock in spring, confirm title and easements, or give planning advice. The Darlington Point result is a fair sample of the output.
FAQ
Who approves solar farms in Victoria? The Minister for Planning is the responsible authority for permit applications for renewable energy facilities of 1 MW or more, under clause 53.13 of Victorian planning schemes. Councils only decide facilities below 1 MW.
Who approves solar farms in NSW? It depends on cost. Electricity generating works with an estimated development cost over $30 million are State Significant Development, decided by the Minister for Planning or the Independent Planning Commission. Below that threshold, a solar farm is an ordinary development application decided by the local council.
Why does your database show only one solar application in Victoria? Because it holds council-lodged applications, and utility-scale solar in Victoria bypasses councils entirely. The near-zero count is the approval system working as designed, not a data error.
Can I build a solar farm on farmland? Often yes, but agricultural land impact is a live merit issue in both states, and both have guidelines steering projects away from irrigated cropping and higher-capability land. Irrigated land in an irrigation district, like our demo parcel, should expect an agricultural impact assessment and community scrutiny.
What planning constraints most often delay solar projects? On our screens, biodiversity and native vegetation overlays carry the most program risk: clearance triggers assessment and likely offsets, and a Phase 1 flora survey runs about 8 to 10 weeks, with seasonal windows that can push timelines much further. Aboriginal heritage and flood data gaps in NSW are the other common schedule items.
How close should a solar site be to transmission? Close enough that connection costs work, which is why our demo parcel, with a 330 kV line 17 metres from its boundary, is attractive on paper. But nearby lines usually carry registered easements with building setbacks, so the same line is both opportunity and constraint. Order the title and confirm easement terms with the network operator early.


