Solutions // Englobo & Subdivision Land
A planning and environment screening memo for englobo and subdivision candidates anywhere in Australia. 19 constraints checked against public spatial data: growth-zone status, native vegetation and EPBC triggers, cultural heritage sensitivity, bushfire and flood read as the future residents' exposure, and the easements that cut lot yield. The filter you run before an option deed, not a substitute for consultants.
The Evidence
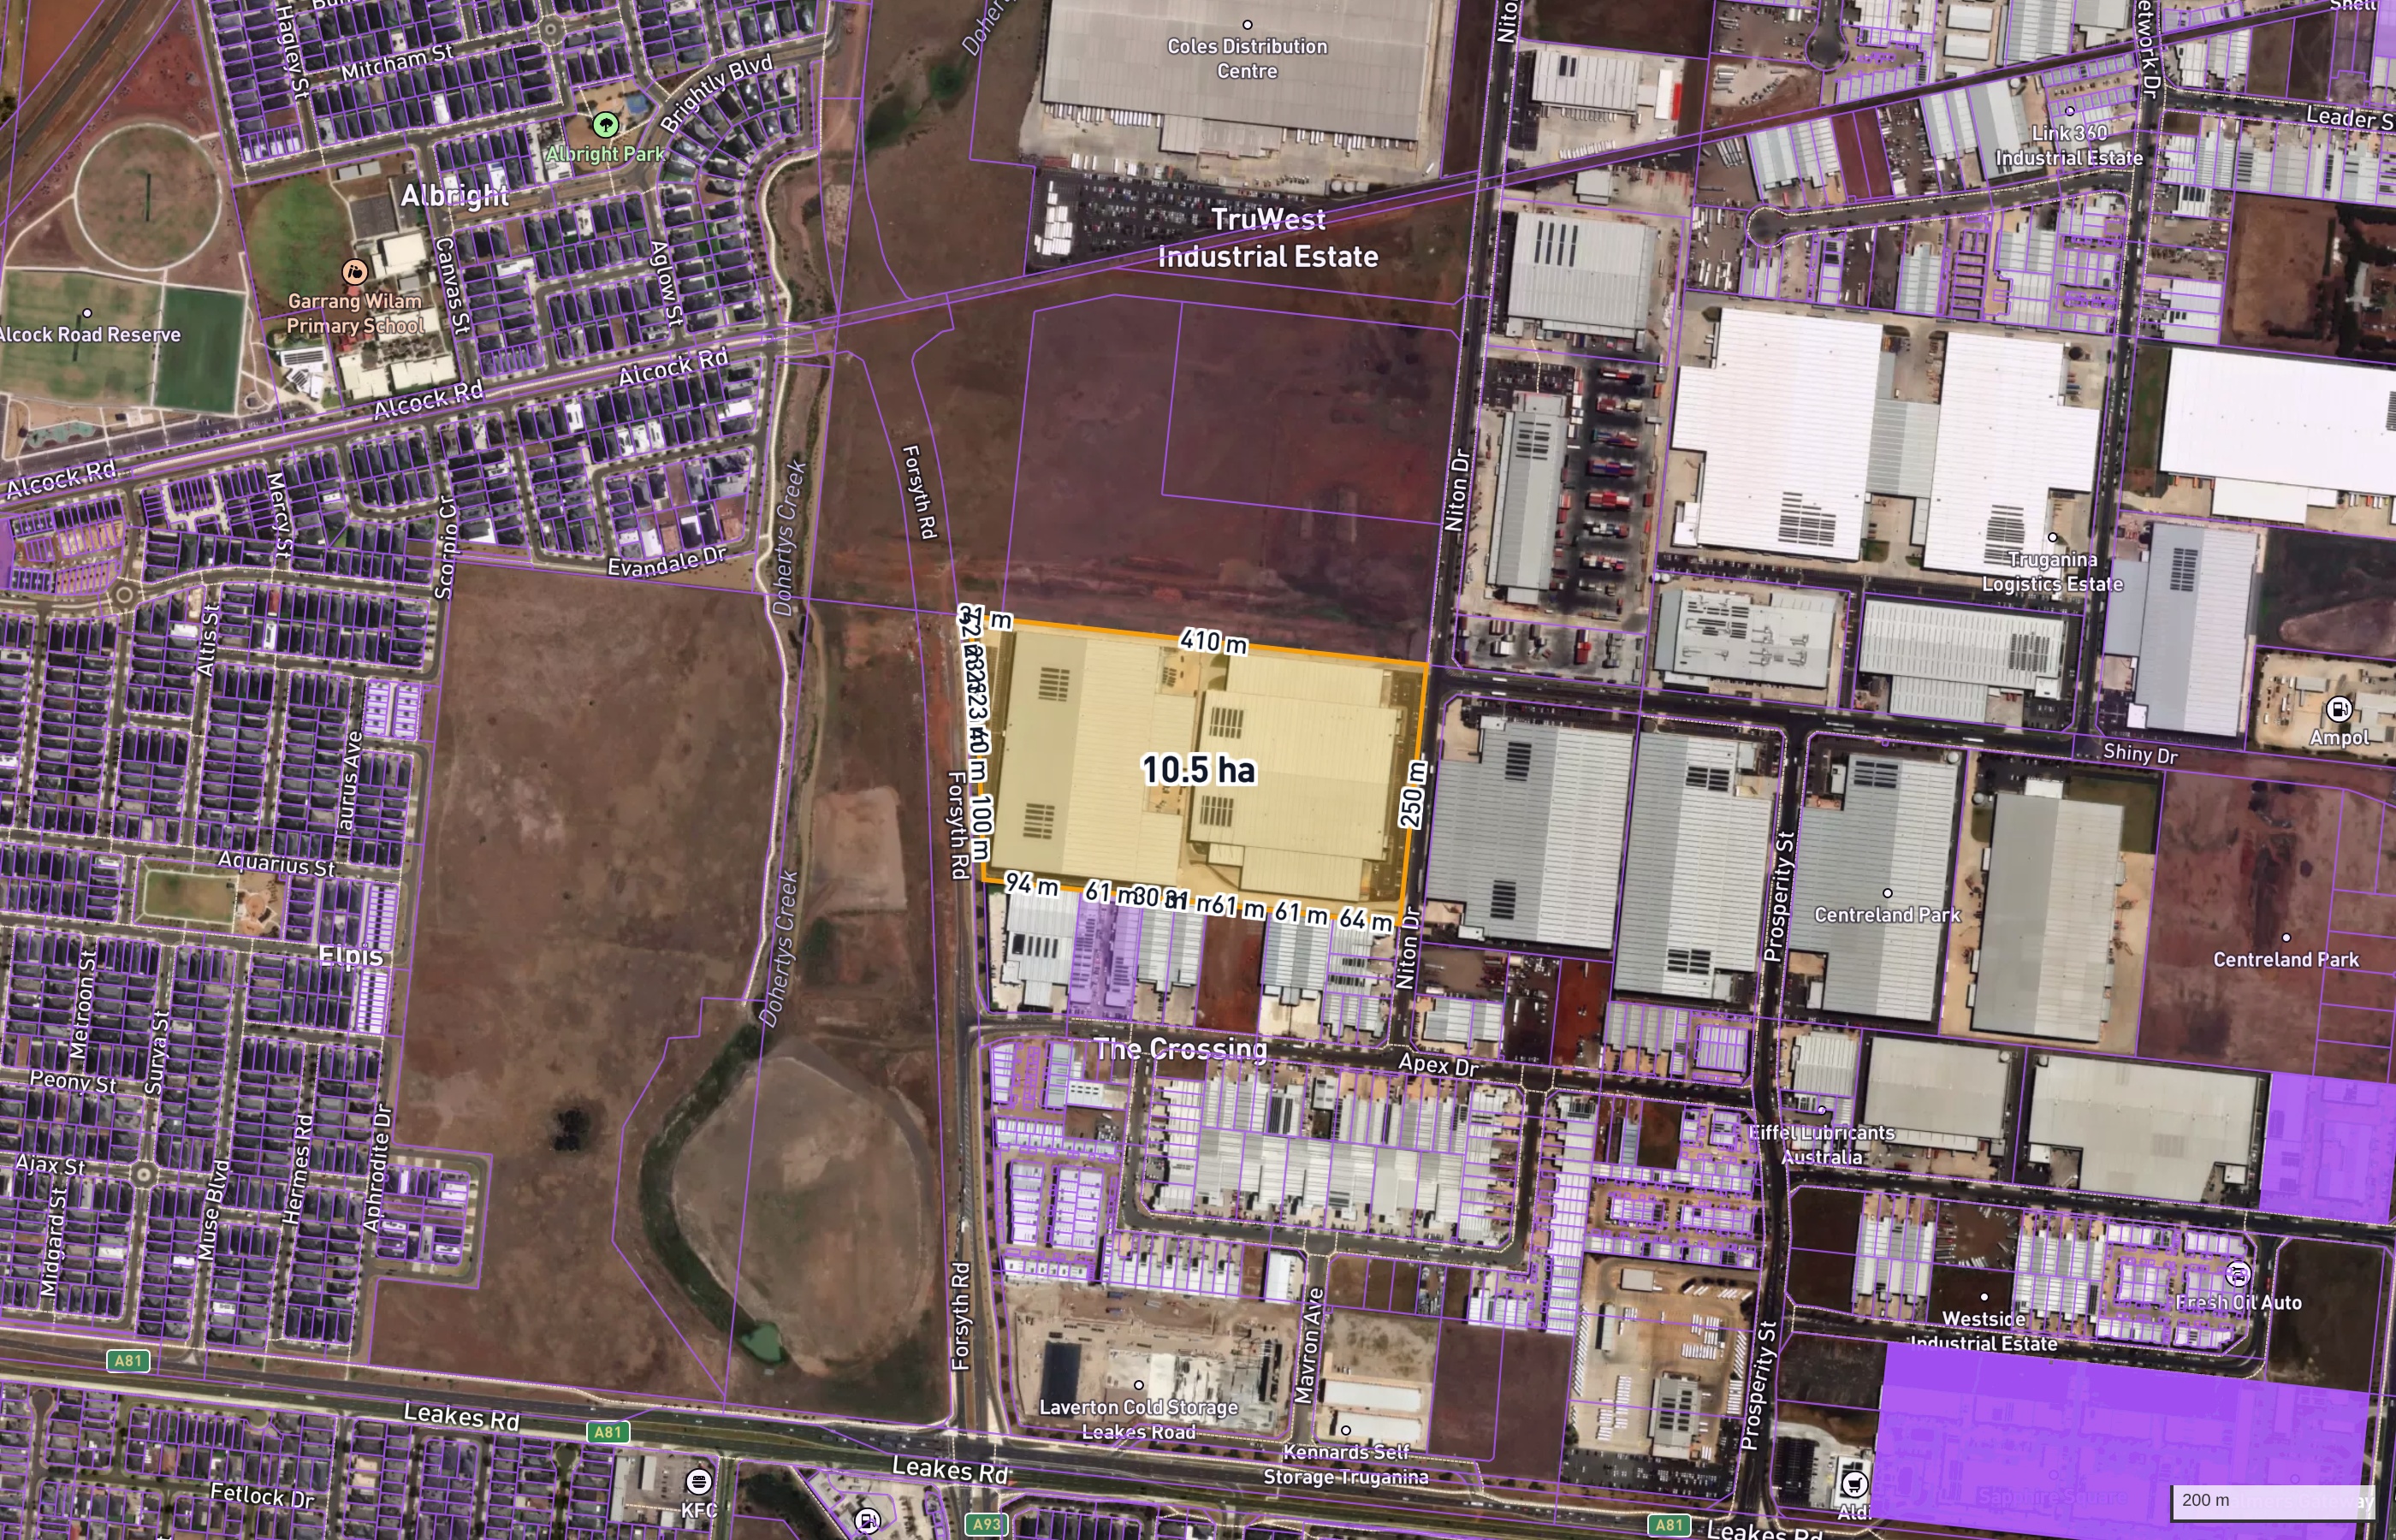
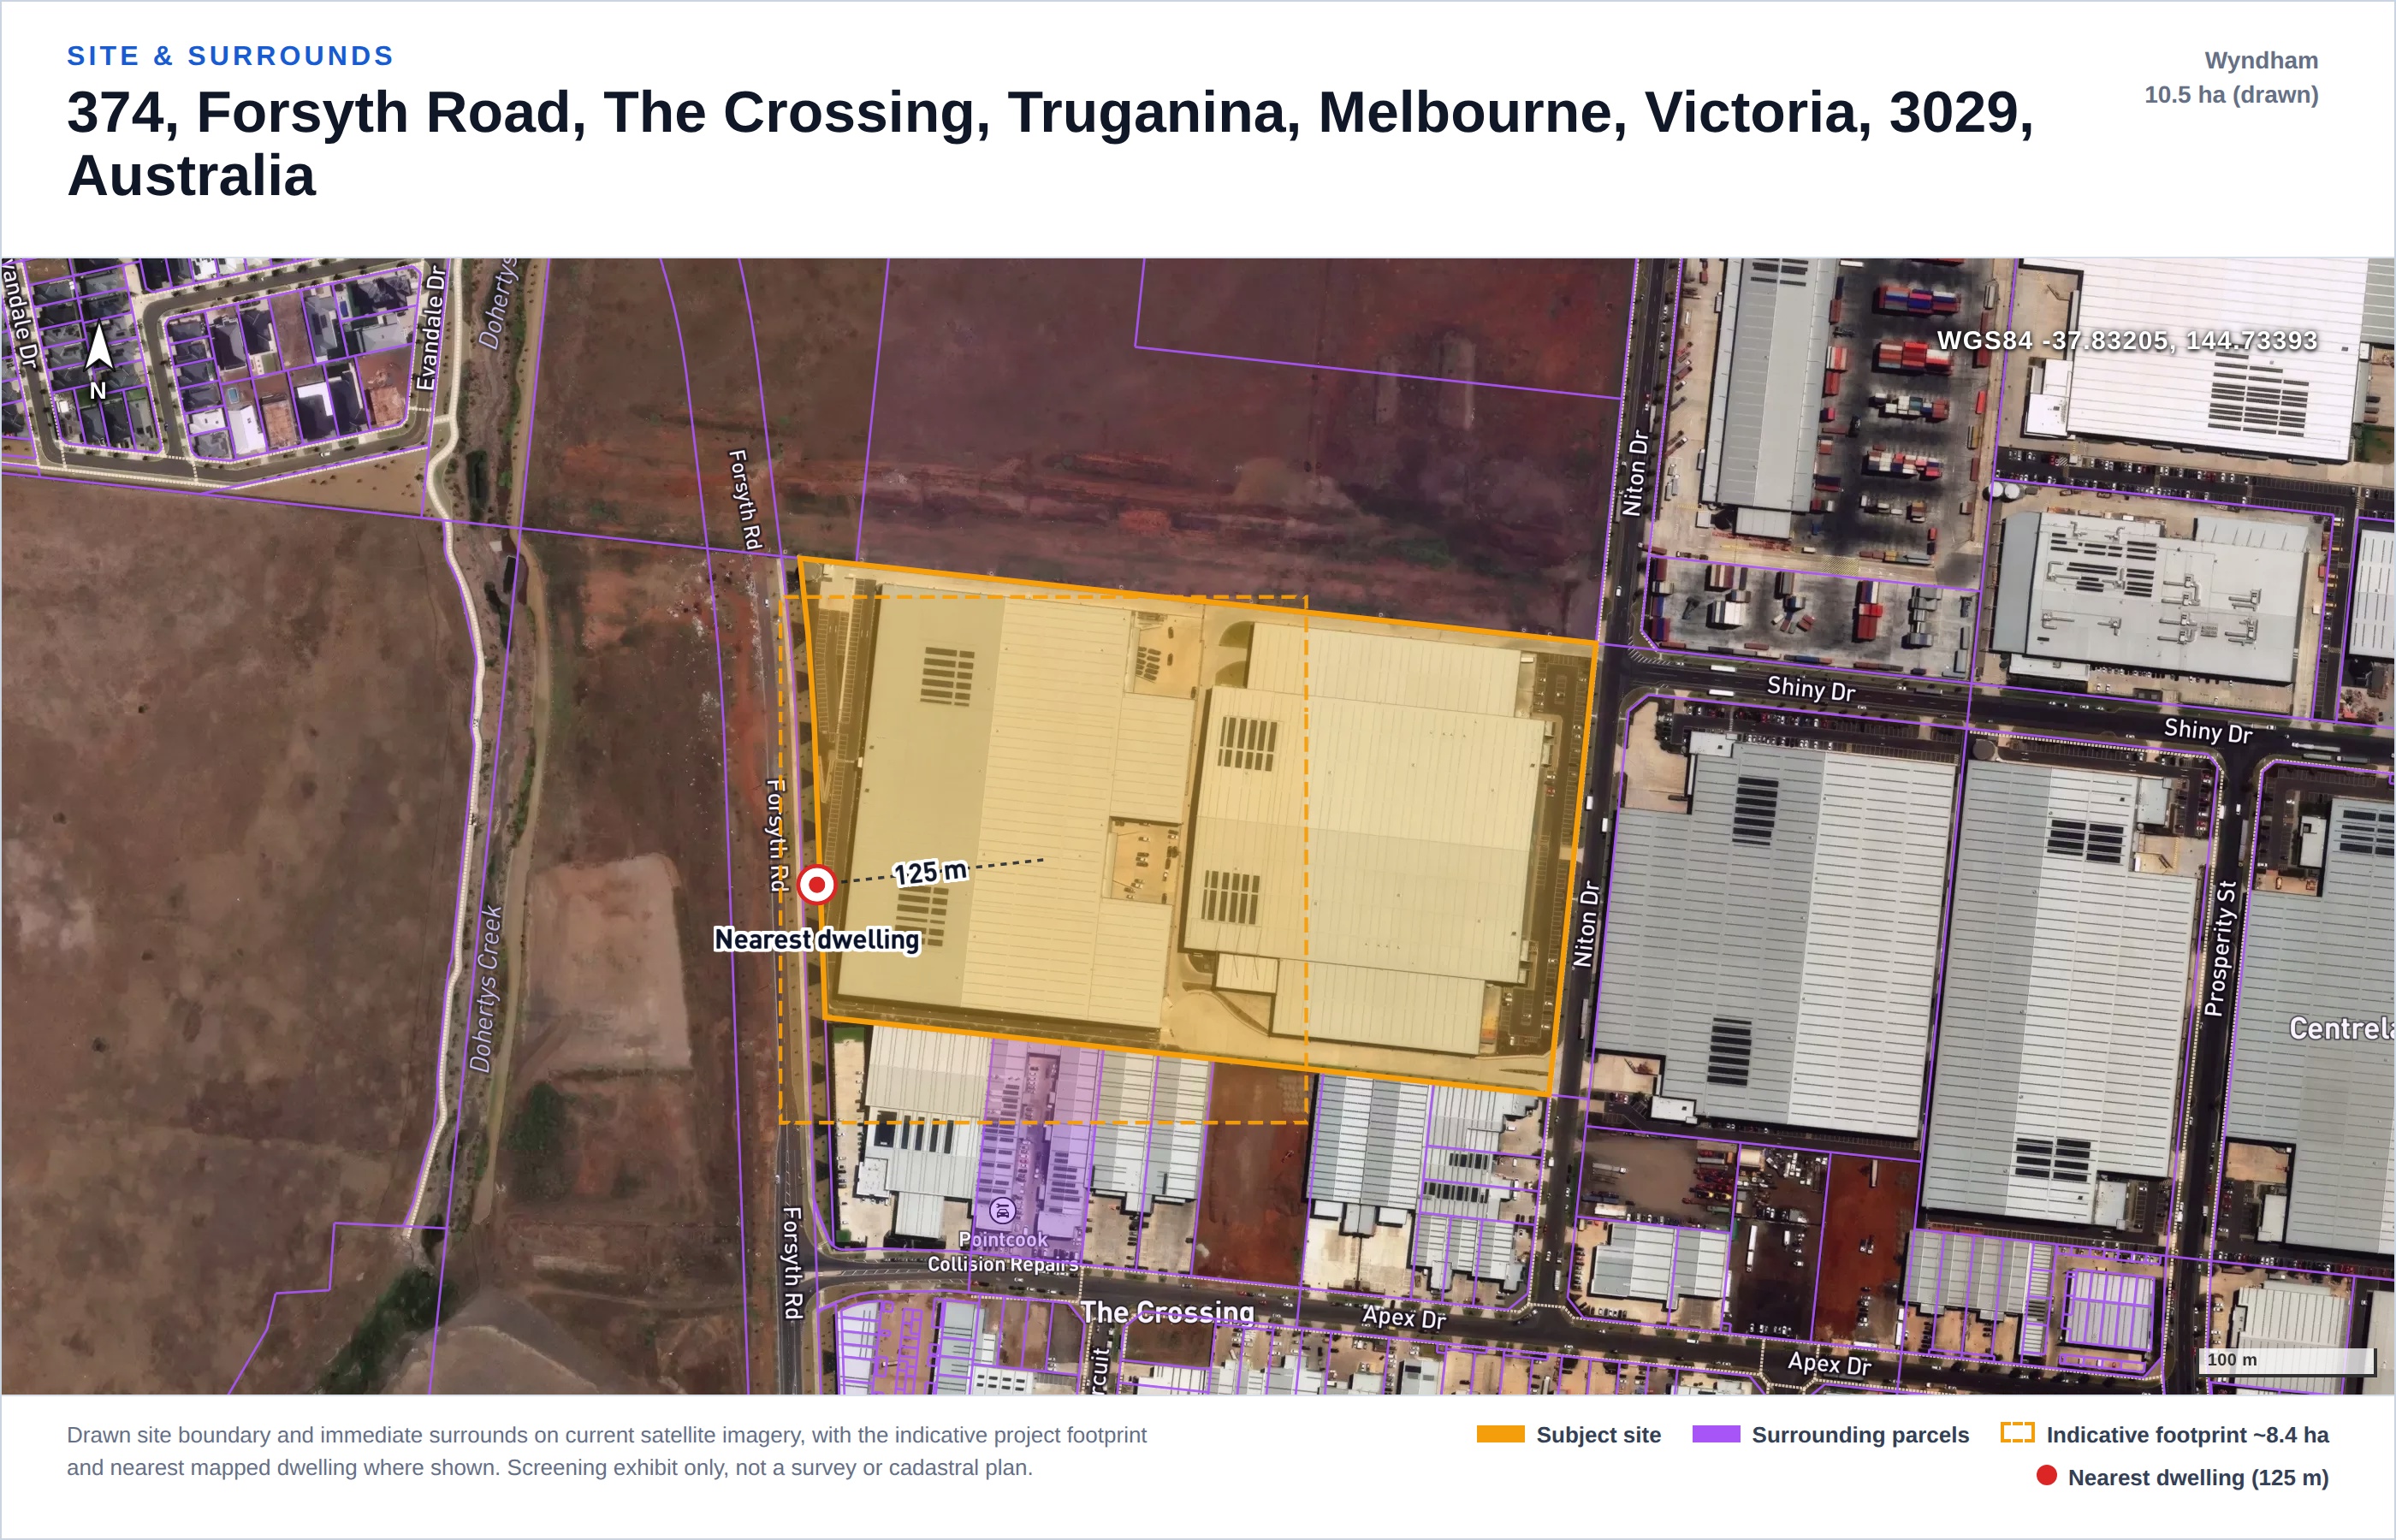
This is the actual constraint table of the sample report: a 10.5 ha Urban Growth Zone parcel at Truganina in Melbourne's western growth corridor. Each row carries its own rating and a separate data status, and in the full report each becomes a section with statutory references and sources. The screen found what really decides englobo land here: volcanic-plain grassland ecology and the EPBC questions that follow, with hazard and noise read the right way around, as the exposure the future dwellings inherit, not as plant impacts the site creates.
Growth & Demand
Every englobo report now carries the demand side from data we already hold: the ABS Census profile of the suburb and the growth trend from our cohort forecasts across 14,000+ suburbs. On the sample site the numbers explain why this land is in play.
These are the suburb's Census and cohort-model facts, not an estate absorption forecast. Lot pricing, staging and absorption modelling stay with your feasibility, and the report says so.
Competition & Amenity
Growth explains the demand; these decide whether your lots move. The competing land already coming to market (our own tracked subdivision applications) and the schools and open space buyers weigh (state education open registers and OpenStreetMap).
64 subdivision applications across the LGA in 12 months, 4,258 state-wide. Counts are our tracked records; council coverage varies, so zero means none tracked, not none lodged.
8 schools within 3.0 km — nearby education access for households considering the catchment, not a school-quality ranking.
Verified state education open registers.
OpenStreetMap at build time. What makes lots sell; not a servicing assessment.
The report is honest about where the desktop ends.
How It Works
No software to adopt, no seats, no onboarding. It slots in front of your existing consultant workflow as an early filter.
An address, coordinates or a boundary file. That is all we need to start.
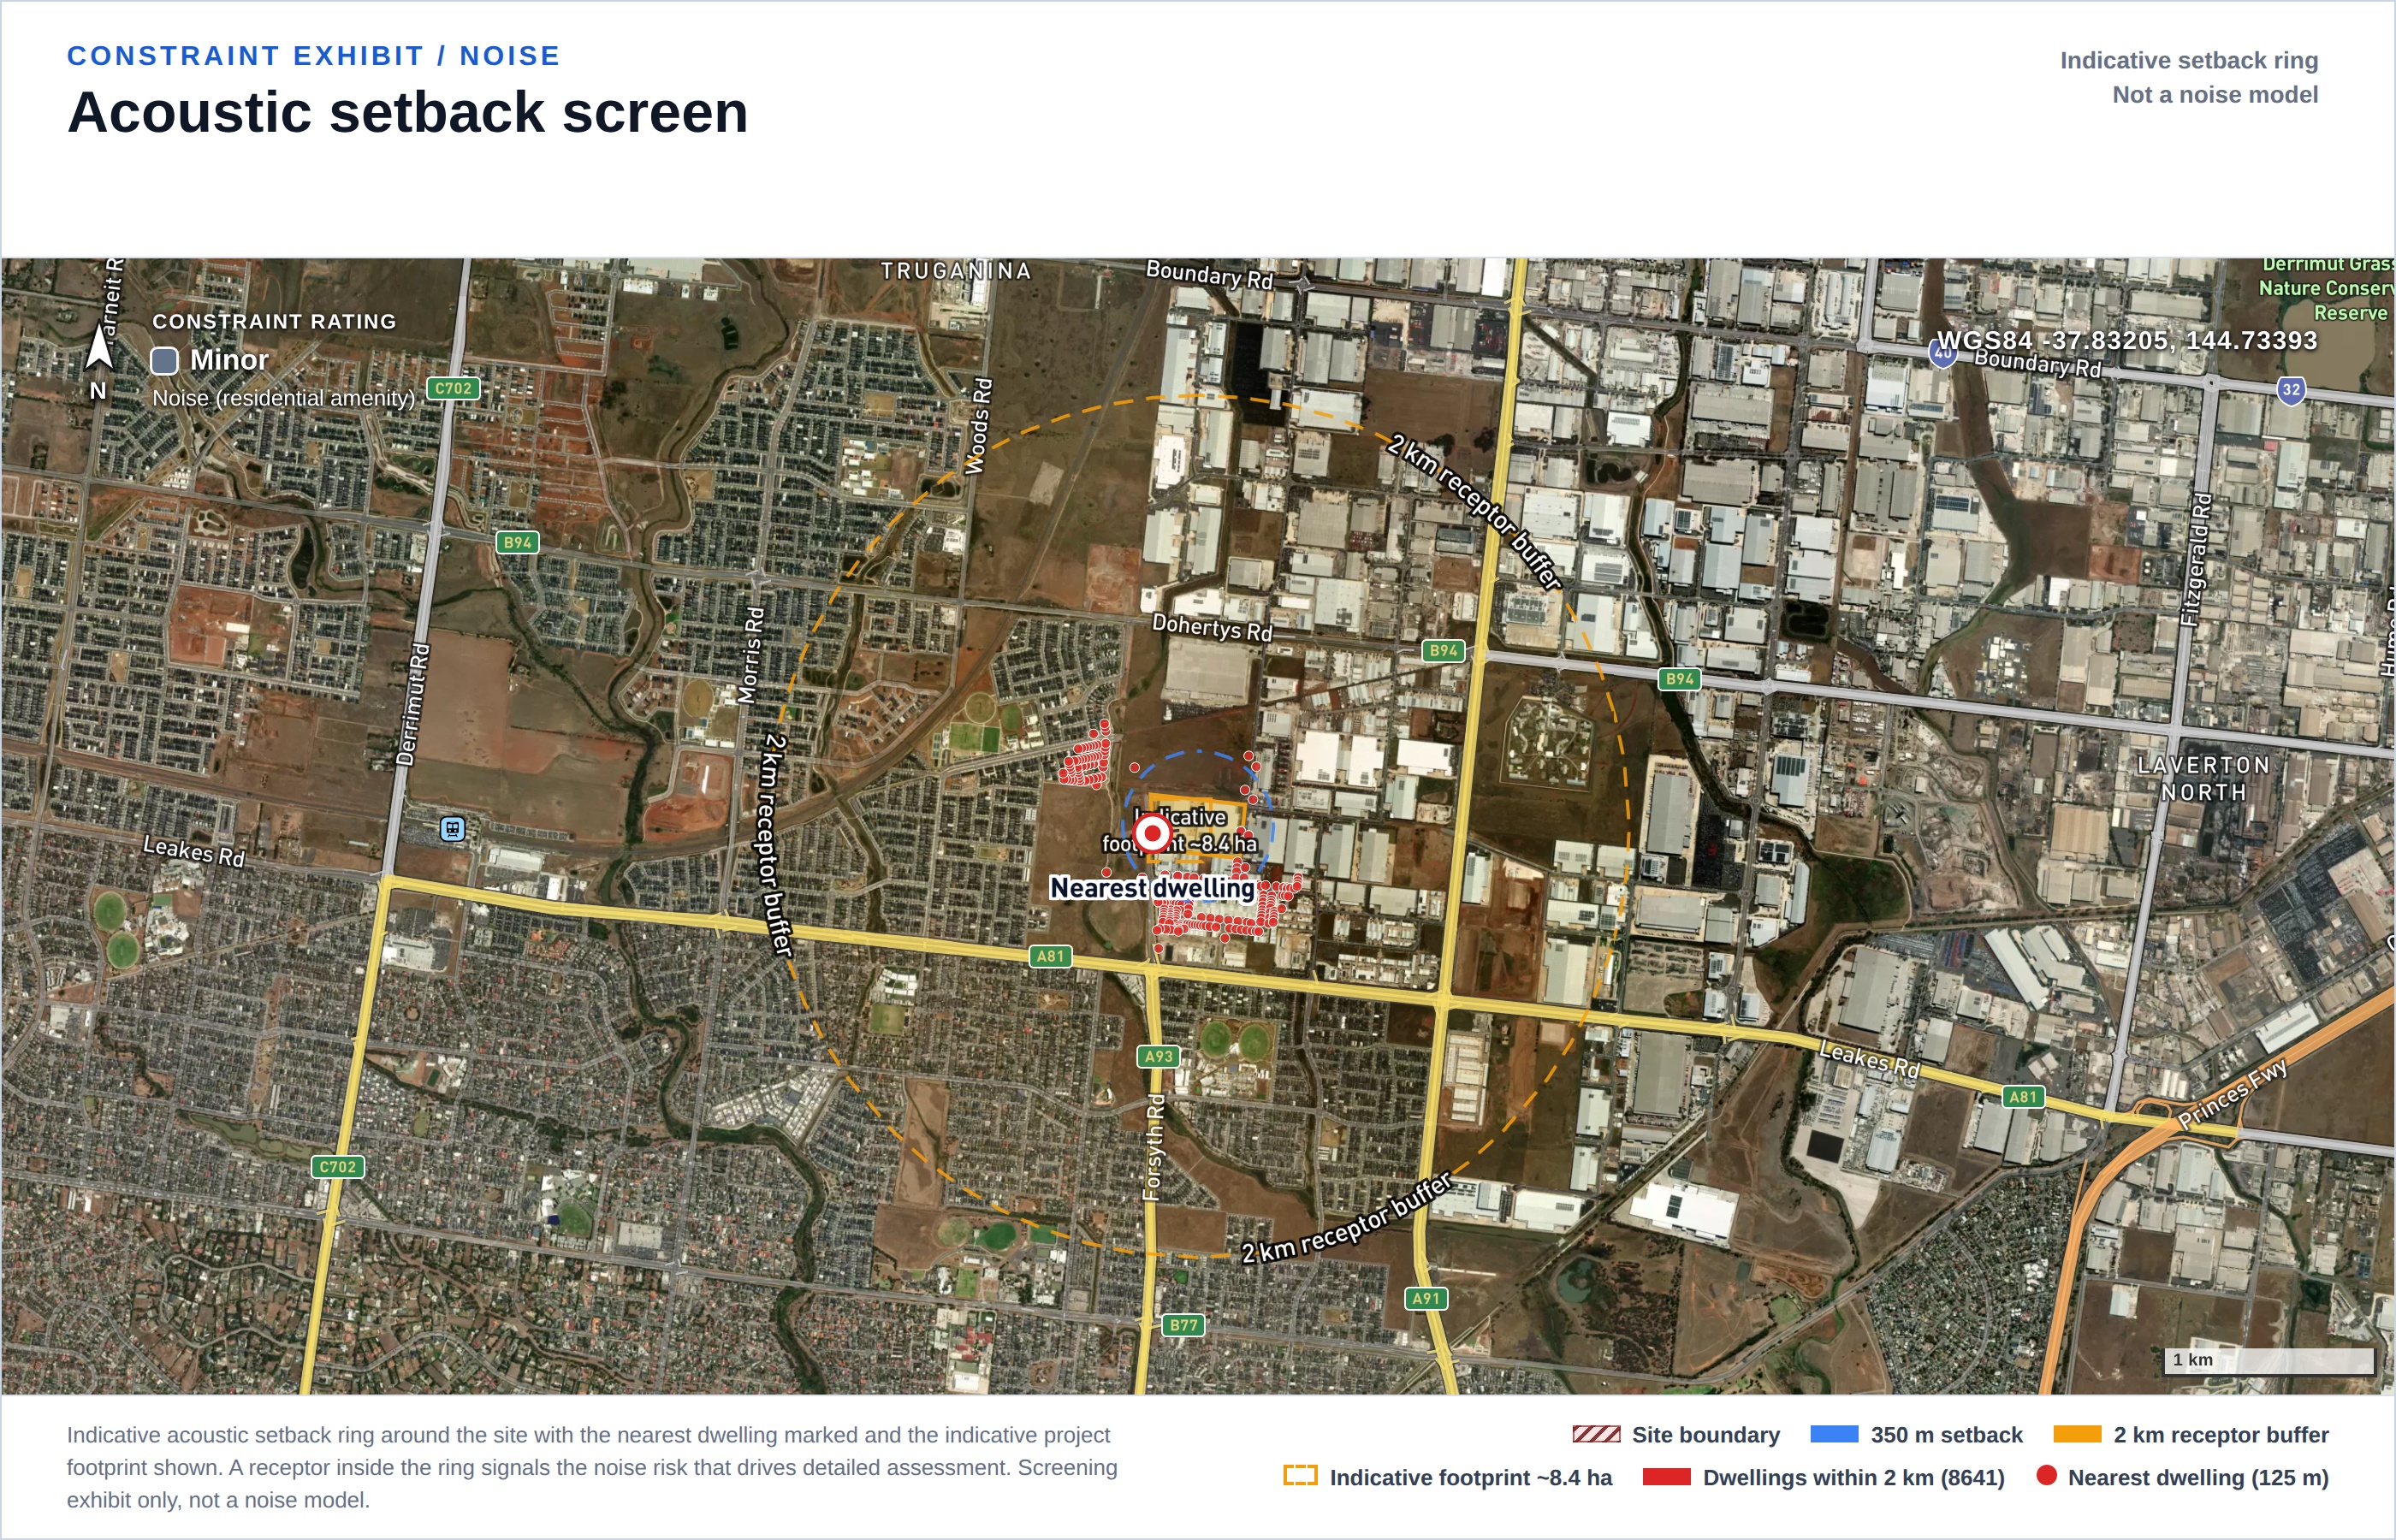
19 constraints against state and federal spatial data: zoning and growth-area status, overlays, easements, bushfire, flooding, EPBC, heritage, soils and more. Ratings are weighted for a sensitive use: the development creates the receptors, so hazard and noise are read as what the future dwellings inherit, not borrowed from an industrial template.
An overall verdict, per-constraint ratings and data status, satellite exhibits, comparable precinct approvals, and the recommended next checks for anything a desktop screen cannot close out.
Honest by Design
Yield and precinct economics. Lot yield is a design and market exercise, and PSP or contributions economics (ICP / DCP levies, servicing costs, staging) are financial modelling. The screen tells you which enabling instruments and constraints apply to the land; it does not model your feasibility.
Servicing capacity agreements. The screen measures distance to mapped water, sewer and power infrastructure. Whether the authority will serve your lots, when, and at what headworks cost is an authority conversation no spatial layer answers.
What the screen does close out early, from public data:
Coverage varies by state and the report says so per constraint: Victorian screens run with full layer coverage; in NSW the Aboriginal heritage register is access restricted and council flood mapping is partial, so those constraints are reported pending there, not assumed clear. This is a preliminary desktop screen to support early site selection; it is not planning advice, and it does not replace the specialist assessments a development application requires.
Field Guides
The research behind this screen is free to read. Every guide below is built on real screens of real parcels and our national development application database.
Every screen runs on the same live planning-data engine behind daleads.com.au, built and run by Bo Wang, a Monash-trained developer working in Australian PropTech.
No inflated case studies, no borrowed logos. The sample report on this page is a real screen you can read end to end, pending items and all.
Pricing
A consultant desktop constraints study typically runs to five figures and takes weeks. This screen exists so you only commission those for sites that survive the first cut.
Constraints that cannot be assessed from public data are disclosed as pending, never padded. If the screen returns materially less than the sample report shows for your state, we will say so before you pay.
Free instant teaser
Type a candidate address and get a free sliver of the screen in seconds, straight from the same live database the paid report runs on: the planning zone at the point, development application activity around it, and what has been lodged nearby. The full 19-constraint screen with verdict and statutory references is the paid report.
Have a shortlist?
Run the free teaser on your address, then request the screen. We reply with a sample section and scope confirmation as soon as we can.