
Subdivision is where the housing pipeline physically begins. One title becomes several, and everything downstream, the civil works, the builders, the mortgages, follows the new lot boundaries. Our council DA database currently holds 848,604 development application records, and 78,670 of them, 9.3%, are subdivisions. This is a straight read of that layer: where the records sit, what a typical one proposes, where the big staged land divisions are being lodged, and what the data can and cannot tell you.
Before any of the numbers, be clear about what this layer is. These are council-lodged records, collected by our scrapers from council registers and planning portals, and our coverage has grown every year as we have added councils and sources. Two consequences follow. First, year-on-year growth in our counts partly reflects our own coverage growing, not just the market. Second, none of these figures are national market totals; they are what the covered registers show. Where a state's planning system routes subdivision away from councils entirely (Western Australia is the clearest case, more on that below), the council layer is structurally thin no matter how much land is being cut.
DA Leads database snapshot, queried 2026-07-12.
Where the records sit
The state split of the 78,670 records:
| State | Subdivision records | Reading note |
|---|---|---|
| NSW | 38,336 | Nearly half the layer. Infill splits are council DAs in NSW, so they all land in registers we scrape. |
| SA | 19,325 | One statewide portal captures everything, so SA is unusually complete. |
| QLD | 12,807 | Appears as "reconfiguring a lot" in the feed; Brisbane's giant single council concentrates the count. |
| VIC | 7,734 | The corridor-scale decisions happen upstream of council DAs (see below). |
| WA | 280 | Coverage-thin in our database, and structurally routed away from councils. Do not read as low activity. |
| ACT | 127 | Coverage-thin in our database. Do not read as low activity. |
(TAS and NT sit at 41 and 20 records respectively: also coverage-thin, same warning.)
The council leaderboard is more interesting:
Look at who is on this table. Brisbane and Logan you might expect. But Canterbury-Bankstown and Ryde are established middle-ring Sydney councils. Charles Sturt, Port Adelaide Enfield and Salisbury are middle-ring Adelaide. Only Casey is a classic capital-city growth corridor municipality, and it sits sixth.
That composition is the first honest finding: a council subdivision leaderboard measures infill volume, not greenfield land supply. The typical subdivision DA is a two-lot split behind an existing house, a duplex subdivision, a battle-axe lot carved out of a deep suburban block: lodged one at a time, in enormous numbers, in established suburbs. A greenfield estate produces far more lots per application but far fewer applications, and in some states the estate-scale decision never touches a council register at all. High counts in Canterbury-Bankstown and Charles Sturt are middle-ring densification happening one backyard at a time.
Two markets share one word
"Subdivision" covers two markets that behave nothing alike. The volume is infill: small, fast, repetitive. The tail is englobo-scale staged subdivision: one parent title cut into hundreds of lots over years of stages. Same word, different businesses.
Our database stores a parsed lot count on 2,963 of the 78,670 subdivision records, so treat everything in this section as a sample of the applications where a count is stated, not a census. Within that sample, the englobo-scale tail (50 or more lots) is thin but unmistakable. The largest lodged recently, all in the first half of 2026:
| Council | Location | Lots | What the record says |
|---|---|---|---|
| Fraser Coast (QLD) | Dundowran | 535 | "One (1) lot into 535 lots in five (5) stages", lodged May 2026 |
| City of Swan (WA) | Brabham | 533 | A WAPC application appearing in the council feed as an invitation to comment, February 2026 |
| City of Casey (VIC) | Growth corridor | 418 | "418 Lot Staged Subdivision, Removal and Creation of Easements and Restrictions", plus a dwelling on a lot under 300 sqm, March 2026 |
| Wakefield (SA) | Port Wakefield | 416 | A variation of a consent first numbered in 2009, lifting the allotment count from 351 to 416, June 2026 |
| Murray Bridge (SA) | Gifford Hill | 346 | "Land Division into 346 allotments" with roads, public reserves and associated infrastructure, June 2026 |
These records read nothing like the volume. A two-lot split is a one-line description and a quick assessment. The englobo records carry staging plans, easement packages, balance lots and public reserves, and in Port Wakefield's case a seventeen-year consent lineage: the 2026 application varies a land division first approved under a 2009-numbered application. Englobo projects live in the planning system for decades, and the DA feed shows each move as it happens.
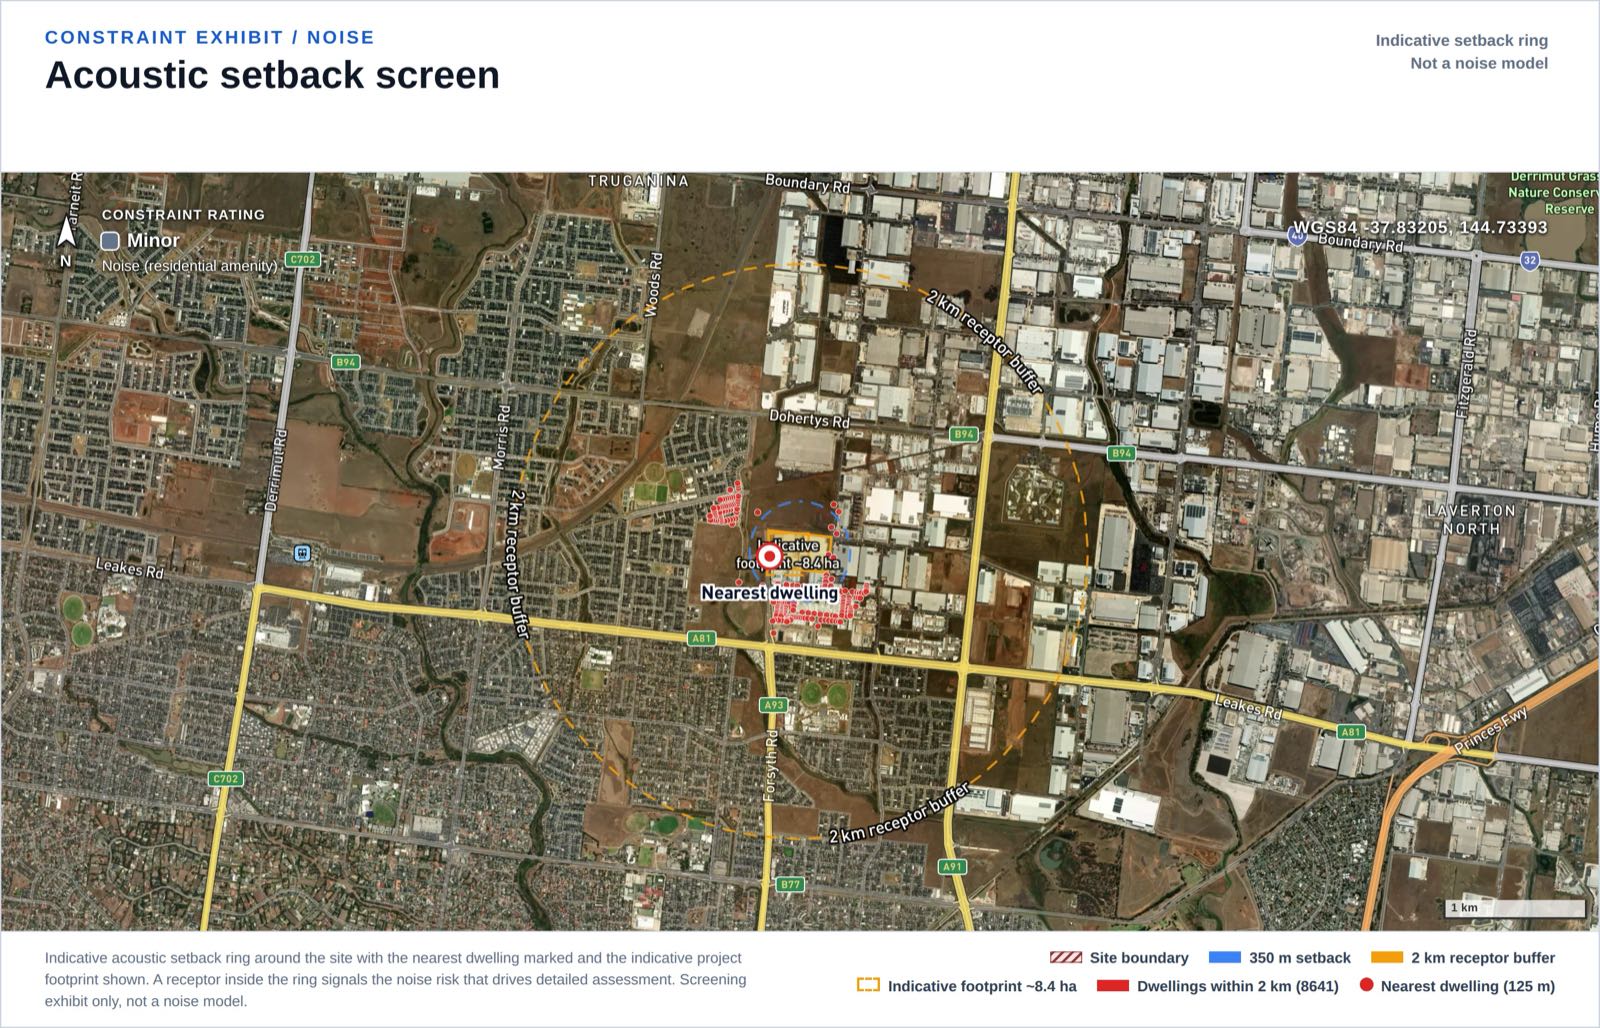
The urban-interface exhibit from our englobo screening demo: a real 10.5 ha Urban Growth Zone parcel at Truganina VIC with the growth-corridor housing front visible around it. A real parcel used to demonstrate the screen, not a client project and not a proposal for that land.
Five years of lodgements, read honestly
The year series for subdivision records in our database:
Read this chart with the coverage caveat, not after it. The climb from 8,770 records in 2021 to 15,836 in 2025 is partly us: our scraper network has covered more councils each year, so earlier years are systematically undercounted. Some of the slope is market, some is measurement, and this table alone cannot separate the two. What the series is genuinely good for is the live view of what was lodged this week within the councils we cover.
The same warning applies to 2026, which stands at 12,182 records to mid-July. The honest statement is narrow: across the registers we cover, subdivision lodgement volume in the first half of 2026 is running at the highest rate in our data.
Why Casey and Brisbane top the same table
The strangest thing about the leaderboard is that a Melbourne growth-corridor council and Brisbane's infill market sit side by side as if they were the same phenomenon. They are not. Different planning systems cast different data shadows, and the leaderboard is a picture of those shadows.
Queensland puts subdivision through councils as "reconfiguring a lot", and Brisbane City Council administers a far larger share of its metropolitan area than any single Sydney or Melbourne council does, so activity that other capitals scatter across dozens of LGAs concentrates in one register. That is most of why Brisbane's 5,323 towers over everyone else.
NSW requires development consent for most subdivision, generally from the local council, unless it qualifies as exempt or complying development. Everything from a Ryde battle-axe lot to an estate stage lands in a council register, which is why NSW carries 38,336 records, and why two established middle-ring Sydney councils make the national top eight on splits and duplex subdivisions rather than greenfield estates.
South Australia runs a single statewide portal, and every application lodged through PlanSA is published on its development application register. Capture is close to total, state-assessed applications included. Three Adelaide middle-ring councils in the top eight reflects genuine infill activity plus that unusually clean capture, not Adelaide cutting lots at three times Melbourne's rate. You can watch the SA feed directly on our SA insights page.
Victoria is the inverse case. In Melbourne's growth corridors, the structural decision happens before any council DA exists: the Victorian Planning Authority prepares a Precinct Structure Plan for land in the Urban Growth Zone, and the PSP lays out roads, schools, open space and housing for the whole precinct. By the time subdivision permits flow through Casey's register, the estate-scale choices are already made, so the council layer shows the retail end of a wholesale process: stage-by-stage subdivision permits like the 418-lot application above, plus ordinary infill. Victoria's modest 7,734 is a data shadow of that structure, not a measure of corridor activity. We walk through the mechanics, and how NSW differs, in our guide to englobo approval pathways in VIC and NSW.
Western Australia routes subdivision away from councils entirely: applications are made directly to the Western Australian Planning Commission, which refers them to local governments for comment and then decides. A WA council register therefore shows referral notices, not the application pipeline. You can see it verbatim in our own feed: the two Brabham records are titled "Invite Comment - Subdivision - WAPC". WA's 280 records are the clearest example in the whole layer of a number that describes a system, not a market.
The one-line takeaway: a council DA count is a measurement taken through each state's planning system, and the system shapes the number as much as the activity does. Any subdivision analysis that ranks states without saying this is comparing shadows and calling them objects.
Querying the layer
This layer is queryable, not a one-off report. If you want the raw feed, /api/v1/property/sample returns live sample records so you can see the fields (descriptions, lodgement dates, statuses, parsed lot counts where stated) before writing any code. For a single site, the free map shows zoning, overlays and parcels for any address in the country.
For englobo work specifically, the DA feed answers "where is activity happening", but the question that kills deals is different: what constraints sit on the parcel you are about to option? That is what our englobo site screening does: a desktop screen of 19 constraints per site, A$1,000 per site in the pilot, turned around in one business day. It is not planning advice and does not replace your consultants; it tells you which sites deserve them. The Truganina parcel in the images is the working demo: a 10.5 ha UGZ parcel that screened at 36/100, "Workable with conditions", no major flags, two moderates (flora and fauna, and a likely EPBC referral), all 19 constraints assessed. The full output is at the sample englobo report.
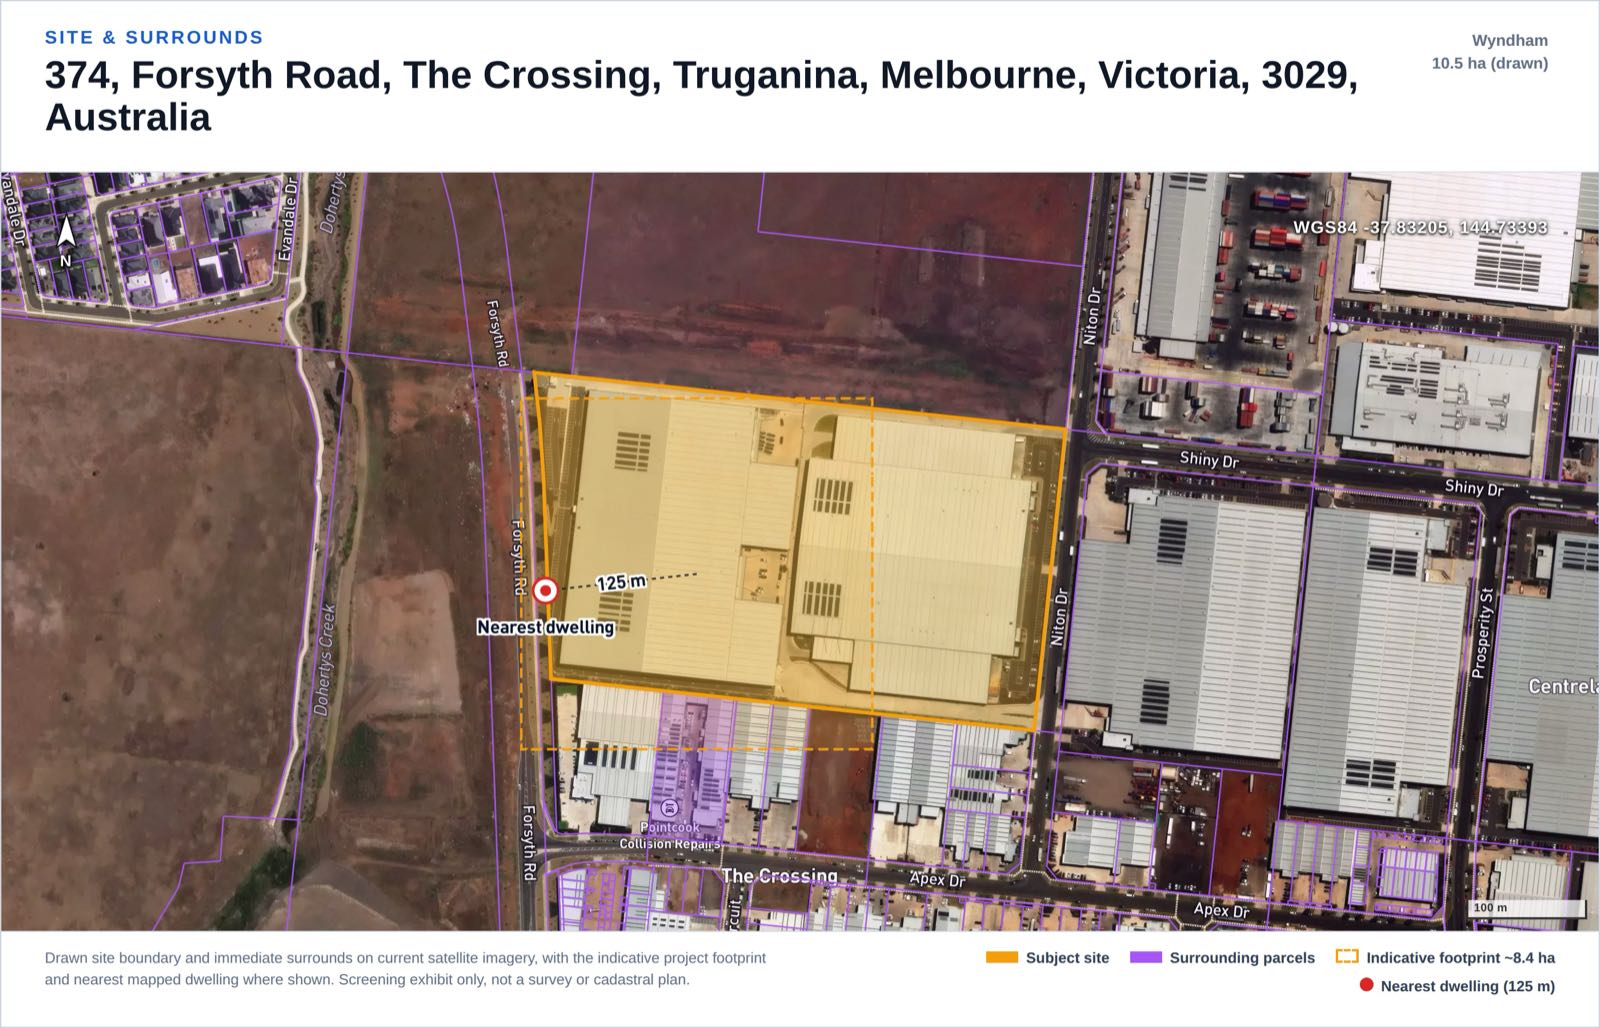
Site and surrounds exhibit from the same demo report. Same disclaimer: a real parcel used as a demonstration, not a proposal for that land.
FAQ
How many subdivision applications are lodged in Australia each year? No one can give you a true national total from council data, and you should be suspicious of anyone who does. Our database holds 15,836 subdivision records lodged in 2025 across the registers we cover, but coverage varies by state and WA subdivision applications mostly never appear in council registers at all. Treat any figure like ours as a floor for the covered registers, not a market total.
Which council has the most subdivision applications? In our data, Brisbane City Council leads with 5,323 subdivision records, ahead of Canterbury-Bankstown (2,011), Charles Sturt (1,968) and Port Adelaide Enfield (1,881). Part of Brisbane's lead is structural: one council administers a far larger share of its metro area than any Sydney or Melbourne council does.
What do most subdivision applications actually propose? Small infill: two-lot splits, duplex subdivisions and battle-axe lots in established suburbs. That is why middle-ring councils in Sydney and Adelaide rank alongside growth-corridor councils. Large staged land divisions of 50 lots or more exist in the data but as a thin tail, and in Victoria the estate-scale decision usually happens in a Precinct Structure Plan before council applications flow.
Where are the largest subdivision projects being lodged right now? The biggest in our snapshot, all lodged in the first half of 2026: 535 lots at Dundowran (Fraser Coast, QLD), 533 lots at Brabham (City of Swan, WA, via the WAPC), a 418-lot staged subdivision in the City of Casey (VIC), 416 allotments at Port Wakefield (SA) and 346 allotments at Gifford Hill, Murray Bridge (SA).
Why does WA show so few subdivision applications in DA data? Because subdivision applications in WA are made directly to the Western Australian Planning Commission, not to councils; local governments only receive them as referrals for comment. Council-sourced datasets, ours included, therefore see referral notices rather than the pipeline. WA's low count describes the system, not the level of activity.
Is subdivision activity growing? Our record counts rose every year from 8,770 in 2021 to 15,836 in 2025, but part of that climb is our scraper coverage expanding, so we do not present it as pure market growth. The defensible claim is narrower: across the registers we cover, lodgement volume in 2025 and the first half of 2026 is the highest in our data.
How can I access the subdivision data? The sample API endpoint returns live records so you can inspect the fields for free, and the map covers zoning, overlays and parcels for any address. For englobo site work, the englobo screening service runs a 19-constraint desktop screen per site, with a full sample report available to read first.


