Deakin
Few ACT suburbs concentrate as much wealth and education as Deakin: household income sits at the 97.7th percentile nationally, and 66.8% of residents hold university qualifications, which is 36.7 points above the national figure. On all four SEIFA indexes the suburb scores decile 10, the top advantage tier. The population of 3,124 is small across 3.57 km2, with a median age of 45 that is 5 years above national average. Ownership is deeply entrenched, with 47.2% owning outright, more than double the mortgage-holder share of 30.7%, pointing to long-held, debt-free wealth rather than recent buyers chasing the market.
Population
3,124
Median Age
45.0
Household IncomeiMedian weekly household income (ABS Census)
$3,117/wk
DAs (12 months)iDevelopment Applications lodged in the past year
20
Median House
$823K
Estimated from rent (2025)
The median house price of $823,000 is an estimate derived from rent data, so treat it as a directional anchor rather than a transaction-confirmed figure. Separate houses dominate at 68.0% of stock, with semi-detached at 18.1% and apartments at just 13.9%, meaning detached supply is relatively consistent with demand. The bedroom profile skews large: 45.7% of dwellings have 4 or more bedrooms and 31.8% have 3 bedrooms, which suits families rather than investors targeting small-unit yield. Monthly mortgage repayments average $3,180, producing a mortgage-to-income ratio of 23.6%, below the 30% stress threshold, comfortable even by ACT standards. Outright owners (47.2%) outnumber mortgage holders (30.7%) by a wide margin, a clear signal that the suburb's wealth is established rather than leveraged.
For Buyers
The median house price of $823,000 is an estimate derived from rent data, so treat it as a directional anchor rather than a transaction-confirmed figure. Separate houses dominate at 68.0% of stock, with semi-detached at 18.1% and apartments at just 13.9%, meaning detached supply is relatively consistent with demand. The bedroom profile skews large: 45.7% of dwellings have 4 or more bedrooms and 31.8% have 3 bedrooms, which suits families rather than investors targeting small-unit yield. Monthly mortgage repayments average $3,180, producing a mortgage-to-income ratio of 23.6%, below the 30% stress threshold, comfortable even by ACT standards. Outright owners (47.2%) outnumber mortgage holders (30.7%) by a wide margin, a clear signal that the suburb's wealth is established rather than leveraged.
For Investors
A renter share of only 22.1% and weekly rent of $560 define a market where owner-occupiers dominate and tenant demand is comparatively thin. Against the $823,000 median, $560 per week implies a gross yield of roughly 3.5%, modest but not negligible for a high-value ACT address. The 10.2% vacancy rate is elevated, signalling that rental stock sits empty longer than in tighter Canberra suburbs. Development activity in the past 12 months shows 19 applications, mostly alterations, lease variations and dual-occupancy works rather than new apartment supply. Net overseas migration averages 28 residents a year, the primary population driver, while internal migration is balanced at net 4 annually. Rent grew 20.4% over the measurement period, outpacing income growth of 11.3%, which supports the rental income case even where yields look moderate.
Development Activity
Total DAs
87
Last 12 Months
20
YoY ChangeiYear-over-year change in DA lodgements
+122.2%
Avg DA CostiAverage estimated cost per DA in the past year
N/A
Monthly DA Lodgements
DA Categories
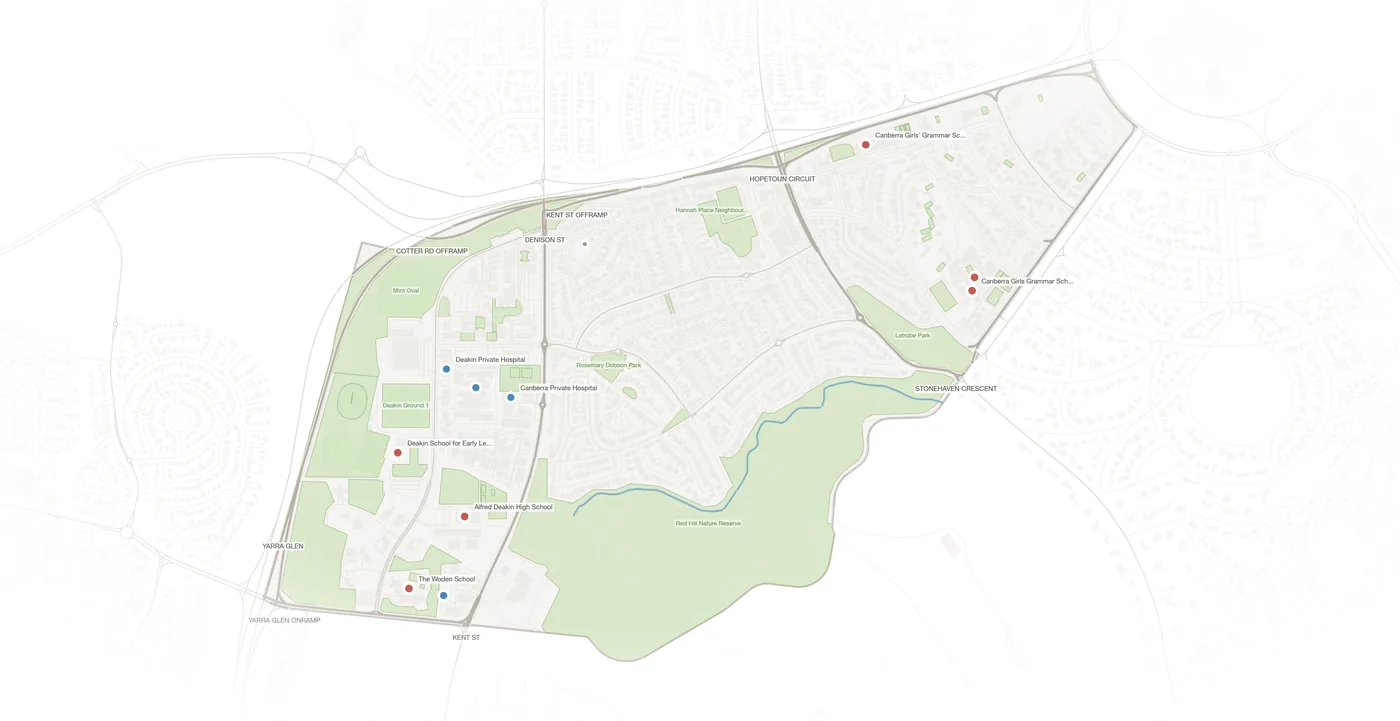
Schools in Deakin iICSEA: school advantage index. 1000 = national avg, higher = more advantaged
Canberra Girls Grammar School
K-12 · 1203 students
Alfred Deakin High School
7-10 · 881 students
Demographics
The median age of 45 is 5 years above the national average, and the suburb is aging: the senior share rose 3.7 points while the working-age share fell 3.6 points over the decade. Overseas-born residents reach 27.6%, which is 6 points above the national figure. Ancestry is predominantly Anglo-Celtic: English (1,219 residents) leads, followed by Irish (415), Other (405) and Scottish (363). Among non-English languages, Mandarin (32 speakers), Hindi (22) and Greek (19) are most common. University qualifications at 66.8% sit 36.7 points above national, ranking among the highest concentrations anywhere in ACT. Average household size is 2.4, marginally below the national figure, consistent with the dominant couples-with-children profile: 1,049 families in this category versus 704 couples without children.
Age Distribution
Bedrooms
Dwelling Structure
68.0%
Houses
18.1%
Townhouse
13.9%
Apartment
Tenure
Tenure is the most distinctive feature: 47.2% own outright, 30.7% carry a mortgage and 22.1% rent. Outright owners outnumbering renters by more than two to one reflects a resident base that arrived decades ago and paid down debt. Separate houses at 68.0% dominate, with semi-detached at 18.1% and apartments at 13.9%, a notably house-heavy mix compared to many ACT inner suburbs. The bedroom spread reinforces the family-home character: 4-plus bedroom dwellings account for 45.7% and 3-bedroom for 31.8%, leaving only 15.5% at 2 bedrooms and 7.1% at 0-1 bedrooms. The $3,180 monthly mortgage repayment against a household income in the 97.7th percentile nationally produces a mortgage-to-income ratio of 23.6%, below stress levels. Rent-to-income at 18.0% is also comfortable, meaning neither owners nor tenants face financial pressure at the median.
Mortgage / mo
$3,180
Rent / wk
$560
HH Size
2.4
Personal Income / wk
$1,577
Vacancy Ratei% of dwellings unoccupied on Census night (ABS 2021)
10.2%
Unoccupied
136
Rent / IncomeiMedian rent as % of household income. Over 30% = housing stress
18.0%
Mortgage / IncomeiMedian mortgage as % of household income. Over 30% = housing stress
23.6%
Community Profile
Languages Spoken at Home
Ancestry
Household Composition
29.5%
Couples, no children
2,386
Total families
Economy & Employment
Public administration dominates the local workforce at 30.3% (385 workers), which is unsurprising given Deakin's proximity to federal government precincts. Professional and technical services follow at 20.0% (254 workers), with healthcare at 15.8% (200) and education at 8.9% (113). By occupation, Professionals (675) and Managers (342) together account for the majority of the employed labour force of 1,460. Unemployment is 2.4%, below the ACT average, and the full-time employment rate is 69.0%. Participation at 57.6% is moderate because 909 residents are not in the labour force, consistent with the aging profile and high rate of outright owners who may be retired. All four SEIFA indexes sit at decile 10, confirming that both education and economic resources are at the top tier nationally.
Unemployment
1.9%
Labour Force
1,679
Unemployed
32
Quarterly Trend
Source: SALM Dec-25
Socio-Economic Indexes (SEIFA)iABS index ranking suburbs from 1 (most disadvantaged) to 10 (most advantaged)
Full-time
69.0%
Part-time
28.6%
Participation
57.6%
Employed
1,460
Occupations
Top Industries
University
66.8%
Postgraduate
26.7%
Born Overseas
27.6%
Dwellings
1,207
Transport to Work
Car use is high at 79.2% of commuters, with 8.5% walking or cycling and only 3.5% using public transport, reflecting Canberra's car-dependent layout rather than any specific deficiency. The suburb earns decile 10 on IRSAD, the top advantage tier nationally, indicating very low deprivation across all measured dimensions. Volunteering runs at 27.2%, well above typical suburban rates, suggesting an engaged and time-rich resident base. Only 5.5% of residents (164 people) need daily assistance, low relative to the median age of 45 that is 5 years above the national figure. No schools are recorded within the suburb boundary in this dataset, so families draw on schools in adjoining areas. Rent-to-income at 18.0% and mortgage-to-income at 23.6% both sit below stress thresholds, meaning housing costs are manageable relative to the 97.7th-percentile income base.
Drive
79.2%
Public Transport
3.5%
Walk / Cycle
8.5%
Work from Home
N/A
Population Forecast
+0.86%/yr
(+28 people/yr)
EstablishedDeakin's population grew 12.4% over the decade, reaching 3,124, and the medium forecast projects it reaching approximately 3,399 by 2031, an annual rate of 0.86% or 28 persons per year. The primary growth driver is overseas migration, averaging 28 per year, while internal migration contributes a balanced net 4. The suburb is classified as established and aging, with no COVID population dip recorded. Gentrification scores at 19, classed as not gentrifying, which fits a suburb already at peak SEIFA advantage with no room to climb further. Affordability improved from 40.4% in 2011 to 35.5% in 2021, a meaningful 4.9-point easing that puts Deakin in a better relative position than it was a decade ago. Resident stability is high: 74.5% stayed in place over the reference period, against a 25.5% turnover rate.
Historical + Forecast
Hamilton-Perry + Holt smoothing on ERP 2001-2025
Age Cohort Forecast
Primary Driver
Balanced
Net Overseas / yr
+28
Net Internal / yr
+4
Gentrification Signal
Not gentrifying
Population +13% since 2011, Accelerating: 2% → 10%
National Ranking iPercentile rank among ~15,000 AU suburbs. 90% = higher than 90% of suburbs
How Deakin compares to ~15,000 Australian suburbs
Frequently Asked Questions
Is Deakin a good suburb to live in?
Deakin ranks at decile 10 on all four SEIFA indexes, the top advantage tier nationally, with household income at the 97.7th percentile. University qualifications reach 66.8%, which is 36.7 points above the national figure. The suburb suits established families and professionals, with 68.0% separate houses and a 47.2% outright-ownership rate.
What is the median house price in Deakin?
The median house price is estimated at $823,000, derived from rental data for 2025. Weekly rent averages $560 and monthly mortgage repayments run about $3,180. The mortgage-to-income ratio sits at 23.6%, below the 30% stress threshold, supported by household incomes in the 97.7th percentile nationally.
What schools are in Deakin?
No schools are recorded within the Deakin boundary in this dataset, so families rely on institutions in neighbouring suburbs. The local population is highly educated, with 66.8% holding university qualifications, which is 36.7 points above the national average, among the highest in the ACT.
Is Deakin safe?
Detailed crime statistics are not available for Deakin in this dataset. As an indirect indicator, the suburb scores decile 10 on the IRSD index of relative disadvantage, the highest tier nationally, and only 5.5% of its 3,124 residents need daily assistance, both consistent with a low-disadvantage, low-risk area.
Is Deakin good for property investment?
Weekly rent of $560 against a $823,000 median implies a gross yield around 3.5%. The 10.2% vacancy rate is elevated and the renter share is only 22.1%, making tenant demand thinner than in higher-density ACT suburbs. Rent grew 20.4% over the measurement period, and overseas migration of 28 per year supports gradual demand. Investment suits those prioritising capital stability over yield volume.
How is Deakin's population changing?
Population grew 12.4% over the decade to 3,124 residents. The current annual growth rate is 0.86% (about 28 persons per year), driven mainly by overseas migration averaging 28 annually. Medium forecasts project the population reaching around 3,399 by 2031. The suburb is aging, with the senior share up 3.7 points and working-age share down 3.6 points over the decade.
How to read these comparisons
Phrases like "above the national average" reference the unweighted median across Australian suburbs with more than 1,000 residents, not population-weighted national figures. Suburb-level medians are more useful for ranking suburbs against each other; ABS census headlines are population-weighted (so dominated by Sydney and Melbourne) and can read very differently.
Current baseline (refreshed 2026-05-10): median age 40, university-educated 30.1%, born overseas 21.6%, average household size 2.5 people.
Data sources: ABS 2021 Census (demographics, income, tenure), state Valuer-General (house prices), Department of Jobs SALM (unemployment), ACARA (school ICSEA), state Crime Statistics agencies (offences), council DA portals (development applications). Population forecasts use a Hamilton-Perry cohort model calibrated to ABS ERP.
Explore Deakin on the Map
View parcels, zoning overlays, DA applications, schools and more.
Open Interactive Map