Forrestdale
A 339% population surge over ten years tells Forrestdale's story more clearly than any other number. With just 1,027 residents across 31.69 square kilometres, it remains one of Perth's least dense fringe suburbs at 32.4 people per km2, yet the SA2 area it belongs to has grown from around 5,000 to over 21,000 since 2011. Household income sits in the 68th percentile nationally, above average, and the IRSD disadvantage decile reaches 9, placing Forrestdale among the least disadvantaged 20% of Australian suburbs. The dominant identity is detached, mortgage-belt growth: 98.8% separate houses and 57% of dwellings with 4 or more bedrooms, pointing to families who have traded proximity for space.
Population
1,027
Median Age
41.0
Household IncomeiMedian weekly household income (ABS Census)
$1,875/wk
DAs (12 months)iDevelopment Applications lodged in the past year
0
Median House
$440K
Estimated from rent (2025)
At an estimated median house price of $440,000, Forrestdale sits well below the Perth metro median, making it one of the more affordable entry points for buyers who can accept a car-dependent lifestyle. Monthly mortgage repayments average $1,733, which works out to a mortgage-to-income ratio of 21.3%, below the 30% stress threshold and lower than most comparable outer suburbs. The stock is almost entirely separate houses at 98.8%, and 57% of dwellings have 4 or more bedrooms, making it a natural fit for families needing space. Owner-occupier momentum is strong: 47.4% carry a mortgage compared to 33.8% who own outright, meaning most residents are still building equity. Renters represent only 18.8% of households, lower than the national average, which limits competition in the owner-occupier market.
For Buyers
At an estimated median house price of $440,000, Forrestdale sits well below the Perth metro median, making it one of the more affordable entry points for buyers who can accept a car-dependent lifestyle. Monthly mortgage repayments average $1,733, which works out to a mortgage-to-income ratio of 21.3%, below the 30% stress threshold and lower than most comparable outer suburbs. The stock is almost entirely separate houses at 98.8%, and 57% of dwellings have 4 or more bedrooms, making it a natural fit for families needing space. Owner-occupier momentum is strong: 47.4% carry a mortgage compared to 33.8% who own outright, meaning most residents are still building equity. Renters represent only 18.8% of households, lower than the national average, which limits competition in the owner-occupier market.
For Investors
The investor case in Forrestdale is driven by population growth rather than yield compression. Weekly rent of $350 against a $440,000 median implies a gross yield near 4.1%, reasonable compared to most capital city suburbs. The vacancy rate of 9.4% is elevated and warrants scrutiny before purchasing, suggesting that rental demand has not yet caught up to the pace of land release in the corridor. Net internal migration adds 681 residents per year to the wider SA2 and overseas migration contributes 284, giving the area a combined inflow well above the national average. Forecast population for the SA2 reaches 27,785 by 2031, a trajectory that should gradually absorb current vacancy. New development activity within the suburb boundary itself recorded zero applications in the past 12 months, suggesting the infill phase has not yet begun.
Schools in Forrestdale iICSEA: school advantage index. 1000 = national avg, higher = more advantaged
Carey Baptist College Forrestdale
PP-12 · 760 students
Australian Islamic College (Forrestdale)
PP-9 · 599 students
Forrestdale Primary School
K-6 · 264 students
Demographics
Forrestdale's median age of 41 sits one year above the national figure, slightly older than typical high-growth corridors. Overseas-born residents account for 24.8% of the population, which is 3.2 percentage points above the national average, with Italian heritage forming a minor but notable secondary group alongside the dominant English, Scottish, Irish and Australian ancestry profile. University qualifications reach 22.0%, which is 8.1 points below the national rate, consistent with a trades and services workforce rather than a knowledge-economy one. The average household size is 2.7, slightly above the national average, reflecting the family-oriented demographic that 4-plus bedroom houses attract. Couples with children make up the largest family type at 320 households, compared to 219 couples without children.
Age Distribution
Bedrooms
Dwelling Structure
98.8%
Houses
N/A
Townhouse
N/A
Apartment
Tenure
The housing stock in Forrestdale is almost entirely detached: 98.8% separate houses, with no meaningful apartment or semi-detached component recorded. Four-bedroom-plus homes account for 57% of all dwellings and three-bedroom homes another 37.2%, so the market is firmly family-sized. Tenure leans heavily to owner-occupiers, with 47.4% carrying a mortgage and 33.8% owning outright, leaving renters at just 18.8%. That low renter share is below the national average and reflects both the suburb's relative affordability and its family composition. Rent-to-income at 18.7% and mortgage-to-income at 21.3% both sit comfortably below stress thresholds, meaning housing costs consume a manageable share of household income compared to inner-city equivalents. The $440,000 median is an estimate derived from rental data because transaction volumes are limited.
Mortgage / mo
$1,733
Rent / wk
$350
HH Size
2.7
Personal Income / wk
$774
Vacancy Ratei% of dwellings unoccupied on Census night (ABS 2021)
9.4%
Unoccupied
36
Rent / IncomeiMedian rent as % of household income. Over 30% = housing stress
18.7%
Mortgage / IncomeiMedian mortgage as % of household income. Over 30% = housing stress
21.3%
Community Profile
Languages Spoken at Home
Ancestry
Household Composition
26.5%
Couples, no children
827
Total families
Economy & Employment
Construction leads employment at 12.9% of workers, which makes sense for a suburb within one of Perth's fastest-growing corridors. Healthcare (11.9%) and Education (9.2%) follow, industries that expand alongside residential population and suggest local services are developing as the area matures. Professional/Technical roles account for 7.1%, below what the income decile might suggest, pointing to residents who commute to knowledge-sector jobs elsewhere rather than work locally. Unemployment runs at 5.7% and the full-time employment rate is 63%, with 84.3% of workers commuting by car. The IRSAD decile of 8 and IRSD decile of 9 both place Forrestdale in the upper advantage tier nationally, above average on both relative disadvantage and advantage measures. The IER decile of 10 is the strongest signal: economic resources in the suburb rank in the top 10% nationally, driven by high home ownership and low debt ratios.
Unemployment
1.5%
Labour Force
12,363
Unemployed
182
Quarterly Trend
Source: SALM Dec-25
Socio-Economic Indexes (SEIFA)iABS index ranking suburbs from 1 (most disadvantaged) to 10 (most advantaged)
Full-time
63.0%
Part-time
31.3%
Participation
59.8%
Employed
467
Occupations
Top Industries
University
22.0%
Postgraduate
3.4%
Born Overseas
24.8%
Dwellings
346
Transport to Work
Car dependence is near-total: 84.3% of residents drive to work, public transport carries just 3.0%, and the suburb's 31.69 km2 spread across Perth's southern fringe means walking is rarely a practical option. No schools are recorded inside the suburb boundary, so families depend on facilities in neighbouring Armadale corridor suburbs. IRSAD decile 8 and IRSD decile 9 both confirm that Forrestdale sits in the upper advantage tier nationally, with very low levels of relative disadvantage. Only 5.8% of residents need daily assistance, compared to the national rate of around 5.1%. Volunteering is active at 19.2% of residents, above the national average, which reflects an engaged and owner-occupier-heavy community. The rent-to-income ratio of 18.7% means renters face minimal housing stress relative to most Australian suburbs.
Drive
84.3%
Public Transport
3.0%
Walk / Cycle
5.7%
Work from Home
N/A
Population Forecast
+5.05%/yr
(+1,101 people/yr)
High GrowthPopulation growth in the Forrestdale SA2 is among the most dramatic in Western Australia. A 339.3% increase over the decade puts the area well above the national average, fuelled by internal migration averaging 681 net arrivals annually and overseas migration adding 284 more each year. Historical population moved from 19,361 in 2023 to 21,815 in 2025, and medium forecasts project 27,785 by 2031 at roughly 5% annual growth. The gentrification stage is classified as new development rather than established-area gentrification, meaning the growth driver is greenfield land release rather than capital-price compression. The young share of the population rose 8.3 points over the decade as families move in, while the senior share held flat, confirming the suburb is getting younger on average as the wider corridor fills out.
Historical + Forecast
Hamilton-Perry + Holt smoothing on ERP 2001-2025
Age Cohort Forecast
Primary Driver
Internal Migration
Net Overseas / yr
+284
Net Internal / yr
+681
Gentrification Signal
New development
National Ranking iPercentile rank among ~15,000 AU suburbs. 90% = higher than 90% of suburbs
How Forrestdale compares to ~15,000 Australian suburbs
Frequently Asked Questions
Is Forrestdale a good suburb to live in?
Forrestdale scores decile 9 on the IRSD disadvantage index, placing it among the least disadvantaged 20% of Australian suburbs. Household income is in the 68th percentile nationally. The trade-off is near-total car dependence, with 84.3% of residents driving to work and no schools recorded inside the suburb boundary.
What is the median house price in Forrestdale?
The estimated median house price is $440,000, well below the Perth metro median. Monthly mortgage repayments average $1,733, giving a mortgage-to-income ratio of 21.3%, below the 30% stress threshold. Weekly rent averages $350, implying a gross yield near 4.1% for investors.
What schools are in Forrestdale?
No schools are recorded inside the Forrestdale suburb boundary in this dataset. Families rely on schools in neighbouring Armadale corridor suburbs. The local area has a university qualification rate of 22.0%, which is 8.1 points below the national figure, consistent with a trades-oriented workforce.
Is Forrestdale safe?
Detailed crime statistics are not available for Forrestdale in this dataset. As indirect indicators, the suburb scores decile 9 on the IRSD index of relative disadvantage, placing it in the top 20% nationally, and just 5.8% of residents need daily assistance, both consistent with a low-disadvantage community.
Is Forrestdale good for property investment?
The wider SA2 is growing at around 5% annually with population forecast to reach 27,785 by 2031. Net internal migration averages 681 arrivals per year. The 9.4% vacancy rate is elevated and worth monitoring, but the $440,000 entry price and 4.1% indicative gross yield compare favourably to most Perth corridors.
How is Forrestdale's population changing?
The SA2 population rose 339.3% over the past decade, from roughly 5,000 to 21,815 by 2025. Annual growth runs at about 5.05%, adding around 1,101 residents per year. Internal migration is the primary driver at 681 net arrivals annually, supplemented by 284 net overseas arrivals.
How to read these comparisons
Phrases like "above the national average" reference the unweighted median across Australian suburbs with more than 1,000 residents, not population-weighted national figures. Suburb-level medians are more useful for ranking suburbs against each other; ABS census headlines are population-weighted (so dominated by Sydney and Melbourne) and can read very differently.
Current baseline (refreshed 2026-05-10): median age 40, university-educated 30.1%, born overseas 21.6%, average household size 2.5 people.
Data sources: ABS 2021 Census (demographics, income, tenure), state Valuer-General (house prices), Department of Jobs SALM (unemployment), ACARA (school ICSEA), state Crime Statistics agencies (offences), council DA portals (development applications). Population forecasts use a Hamilton-Perry cohort model calibrated to ABS ERP.
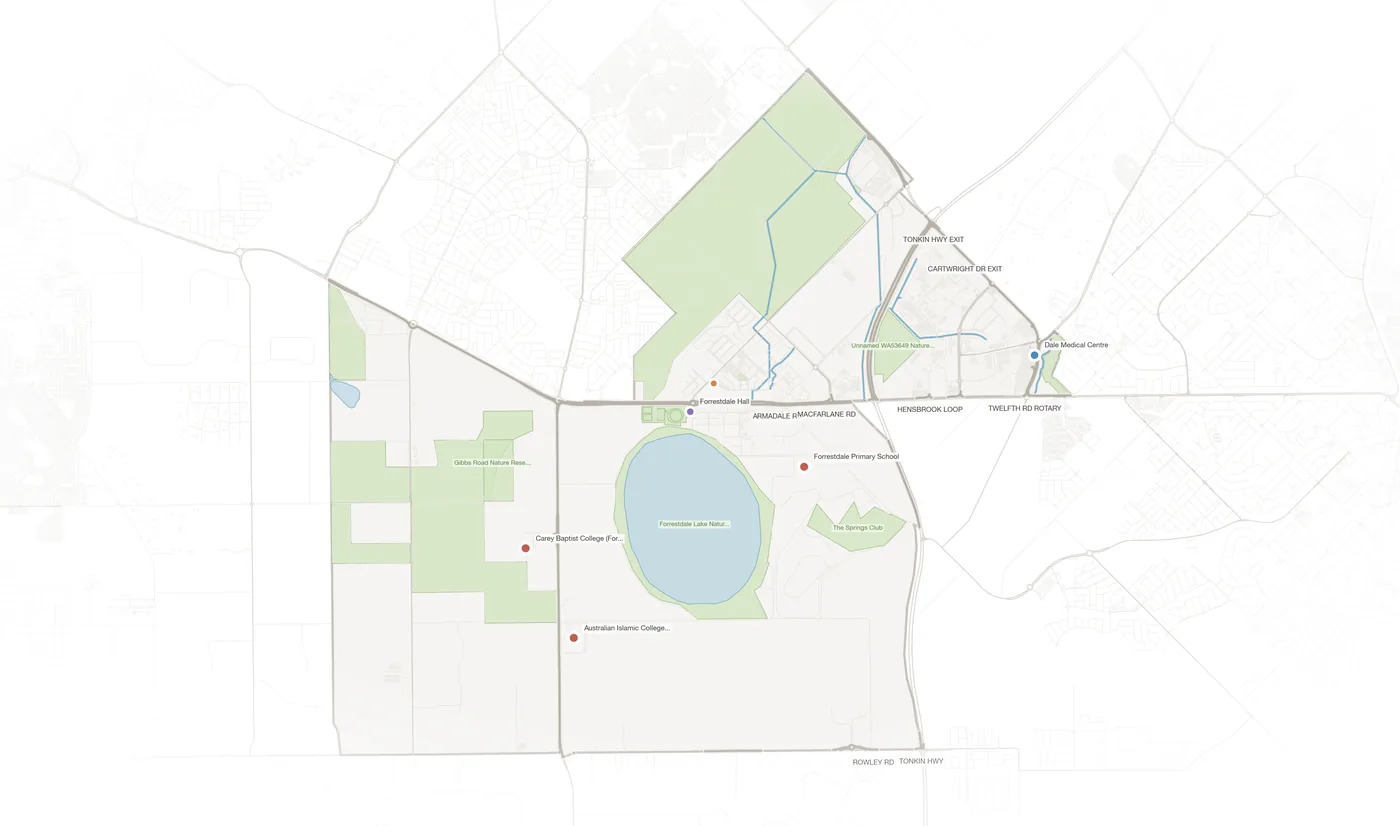
Explore Forrestdale on the Map
View parcels, zoning overlays, DA applications, schools and more.
Open Interactive Map