Greenwood
Only 14.2% of Greenwood households rent, less than half the national average, making it one of the most owner-dominated suburbs in Perth's northern corridor. The 84.0% residential stability rate (proportion who did not move in the last year) sits well above the national median, and 37.3% own outright, reflecting a mature suburb where equity has accumulated over decades. University qualifications at 33.2% run 3.1 points above the national average, yet SEIFA scores cluster in the mid-range (IRSAD decile 7, IEO decile 7), placing Greenwood in an unremarkable middle band that belies its strong tenure profile.
Population
9,861
Median Age
40.0
Household IncomeiMedian weekly household income (ABS Census)
$1,949/wk
DAs (12 months)iDevelopment Applications lodged in the past year
3
Median House
$496K
Estimated from rent (2025)
The estimated $496,000 median house price makes Greenwood accessible relative to inner Perth, with monthly mortgage repayments of $1,972 producing a mortgage-to-income ratio of 23.4%, well below the 30% stress threshold. Detached houses dominate at 92.5%, with three-bedroom (45.1%) and four-plus-bedroom (52.4%) stock accounting for 97.5% of all dwellings, so buyers seeking apartments or smaller formats will find almost nothing. The suburb's 84.0% stay rate (only 16.0% turnover) means listed stock is scarce, creating competition when homes do come to market. All four local schools score above the national ICSEA benchmark of 1,000.
For Buyers
The estimated $496,000 median house price makes Greenwood accessible relative to inner Perth, with monthly mortgage repayments of $1,972 producing a mortgage-to-income ratio of 23.4%, well below the 30% stress threshold. Detached houses dominate at 92.5%, with three-bedroom (45.1%) and four-plus-bedroom (52.4%) stock accounting for 97.5% of all dwellings, so buyers seeking apartments or smaller formats will find almost nothing. The suburb's 84.0% stay rate (only 16.0% turnover) means listed stock is scarce, creating competition when homes do come to market. All four local schools score above the national ICSEA benchmark of 1,000.
For Investors
With just 14.2% renting, the tenant pool is shallow compared to most suburbs. Median weekly rent of $390 against an estimated $496,000 median delivers a gross yield around 4.1%, which is above the national average but constrained by the small rental market. The vacancy rate of 4.9% is moderate. Only 2 development applications were lodged in 12 months, both for grouped dwellings, confirming minimal new supply. Population growth averages a negligible 60 persons per year, so tenant demand growth is likely to remain flat without a catalyst such as infill rezoning.
Development Activity
Total DAs
3
Last 12 Months
3
YoY ChangeiYear-over-year change in DA lodgements
—
Avg DA CostiAverage estimated cost per DA in the past year
N/A
Monthly DA Lodgements
DA Categories
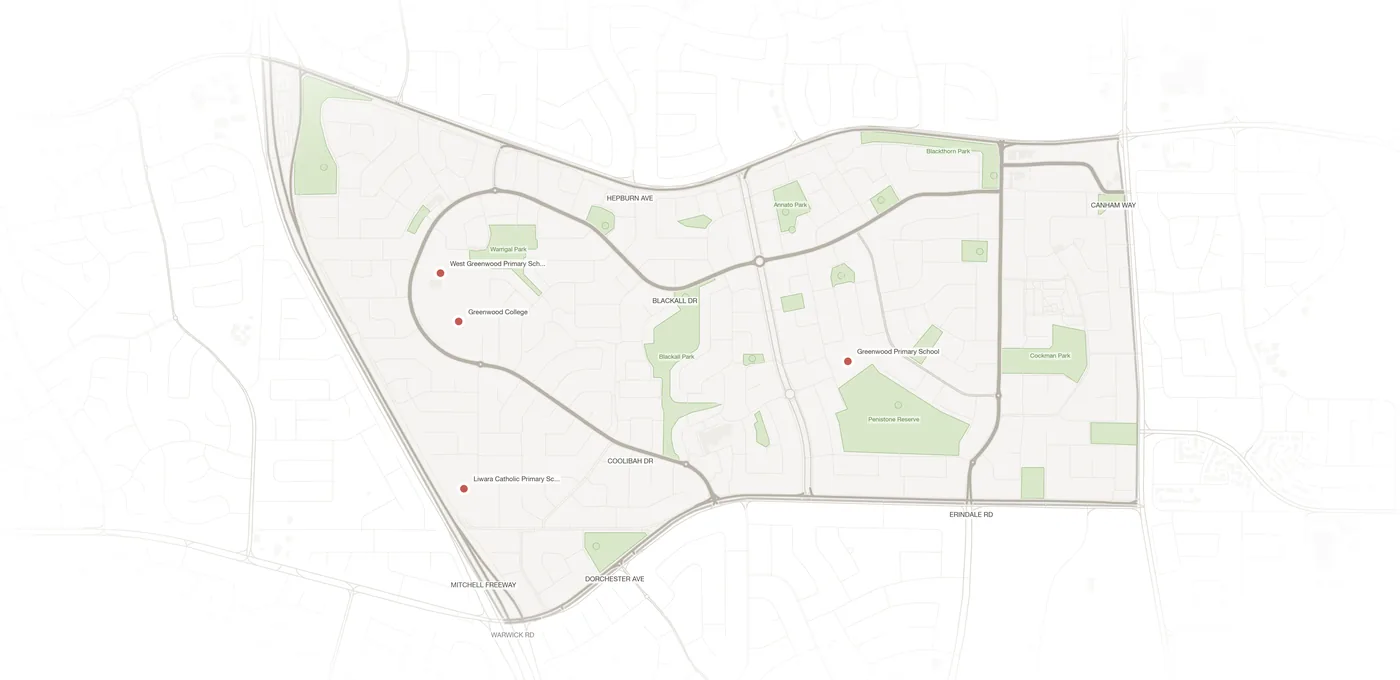
Schools in Greenwood iICSEA: school advantage index. 1000 = national avg, higher = more advantaged
Liwara Catholic Primary School
PP-6 · 394 students
West Greenwood Primary School
K-6 · 382 students
Greenwood College
7-12 · 944 students
Greenwood Primary School
K-6 · 336 students
Demographics
English ancestry leads at 4,210, followed by Irish (1,255), Scottish (1,052), and Italian (504). With 28.5% born overseas (6.9 points above the national average), the overseas-born share is notable but does not dominate. Italian (38), Mandarin (33), and French (24) are the leading non-English languages, all at low absolute counts. The median age of 40 matches the national figure, and average household size of 2.6 is near the national 2.5. Couples with children (3,551) outnumber couples without (2,168), and the volunteering rate of 18.0% runs higher than the national average.
Age Distribution
Bedrooms
Dwelling Structure
92.5%
Houses
7.3%
Townhouse
0.2%
Apartment
Tenure
Ownership runs high: 37.3% outright and 48.5% with a mortgage, leaving just 14.2% renting. The 92.5% detached-house share and near-absence of apartments (0.2%) mean the built form is almost entirely single-residential. Three-bedroom stock at 45.1% and four-plus at 52.4% leave minimal room for smaller dwelling types. At $496,000 estimated median, Greenwood sits roughly in line with Perth's outer-middle ring. The mortgage-to-income ratio of 23.4% is comfortable, and rent-to-income at 20.0% is similarly modest, suggesting neither tenure pathway creates acute financial pressure at current price levels.
Mortgage / mo
$1,972
Rent / wk
$390
HH Size
2.6
Personal Income / wk
$876
Vacancy Ratei% of dwellings unoccupied on Census night (ABS 2021)
4.9%
Unoccupied
189
Rent / IncomeiMedian rent as % of household income. Over 30% = housing stress
20.0%
Mortgage / IncomeiMedian mortgage as % of household income. Over 30% = housing stress
23.4%
Community Profile
Languages Spoken at Home
Ancestry
Household Composition
26.5%
Couples, no children
8,174
Total families
Economy & Employment
Healthcare leads at 16.8% (586 workers), followed by Education at 13.3% (466) and Construction at 12.6% (442). Professional/Technical services at 10.0% and Public Administration at 7.3% round out the top five. Professionals (1,278) dominate occupations, with Clerical/Admin (709) and Managers (582) following. The unemployment rate of 4.9% is near the national average, while participation at 62.3% and full-time employment at 62.6% are solid. The SEIFA IER decile 8 confirms above-average economic resources, consistent with the high ownership rate and moderate incomes.
Socio-Economic Indexes (SEIFA)iABS index ranking suburbs from 1 (most disadvantaged) to 10 (most advantaged)
Full-time
62.6%
Part-time
32.5%
Participation
62.3%
Employed
4,677
Occupations
Top Industries
University
33.2%
Postgraduate
6.4%
Born Overseas
28.5%
Dwellings
3,660
Transport to Work
All four schools score above the national ICSEA benchmark: Liwara Catholic Primary (1,092, 394 students), West Greenwood Primary (1,051, 382 students), Greenwood College secondary (1,038, 944 students), and Greenwood Primary (1,013, 336 students). This breadth of above-average schooling across government, Catholic, and secondary sectors is uncommon. Car dependence at 86.5% is typical for Perth's middle suburbs, with public transport at 6.8%. The IRSAD decile 7 and IRSD decile 8 confirm above-average advantage and low relative disadvantage. Need-for-assistance at 3.9% is well below the national average.
Drive
86.5%
Public Transport
6.8%
Walk / Cycle
1.8%
Work from Home
N/A
National Ranking iPercentile rank among ~15,000 AU suburbs. 90% = higher than 90% of suburbs
How Greenwood compares to ~15,000 Australian suburbs
Frequently Asked Questions
Is Greenwood a good suburb to live in?
Greenwood suits families wanting large detached homes (92.5% of stock) with access to 4 above-benchmark schools (all ICSEA above 1,000). The estimated $496,000 median is accessible, and the mortgage-to-income ratio of 23.4% stays well below the stress threshold. IRSAD decile 7 confirms above-average socioeconomic standing.
What is the median house price in Greenwood?
The estimated median is $496,000, derived from rental data. Monthly mortgage repayments average $1,972, and median weekly rent is $390. The mortgage-to-income ratio of 23.4% is comfortable against the $1,949/week household income, which sits in the 73.2nd percentile nationally.
What schools are in Greenwood?
Greenwood has 4 schools, all above the national ICSEA benchmark of 1,000: Liwara Catholic Primary (1,092, 394 students), West Greenwood Primary (1,051, 382 students), Greenwood College secondary (1,038, 944 students), and Greenwood Primary (1,013, 336 students). This covers primary through secondary across government and Catholic sectors.
Is Greenwood safe?
Crime-specific data is not available in the current dataset. The IRSD decile 8 indicates low relative disadvantage, and the 4.9% unemployment rate is near the national average. The 84.0% residential stability rate and 85.8% ownership rate (outright plus mortgage) are typically associated with lower crime in comparable Australian suburbs.
Is Greenwood good for property investment?
Gross yield is approximately 4.1% ($390/week on $496,000), above the national median. However, the 14.2% renter share means the tenant pool is small, and population growth is effectively flat at negative 19 persons per year. Only 2 DAs were lodged in 12 months, so supply pressure is minimal. This is a stable hold rather than a growth play.
How is Greenwood's population changing?
The population is marginally declining at 0.22% per year (negative 19 persons), with the 2025 estimate at 10,043. Internal migration runs at negative 81/year, partly offset by overseas arrivals of 47/year. The median age of 40 matches the national figure, and gentrification score sits at 0, confirming a stable, non-transitioning suburb.
How to read these comparisons
Phrases like "above the national average" reference the unweighted median across Australian suburbs with more than 1,000 residents, not population-weighted national figures. Suburb-level medians are more useful for ranking suburbs against each other; ABS census headlines are population-weighted (so dominated by Sydney and Melbourne) and can read very differently.
Current baseline (refreshed 2026-05-10): median age 40, university-educated 30.1%, born overseas 21.6%, average household size 2.5 people.
Data sources: ABS 2021 Census (demographics, income, tenure), state Valuer-General (house prices), Department of Jobs SALM (unemployment), ACARA (school ICSEA), state Crime Statistics agencies (offences), council DA portals (development applications). Population forecasts use a Hamilton-Perry cohort model calibrated to ABS ERP.
Explore Greenwood on the Map
View parcels, zoning overlays, DA applications, schools and more.
Open Interactive Map