Peppermint Grove
Household income in the 99.8th percentile nationally makes Peppermint Grove one of the wealthiest postcodes in Australia, concentrated into just 1.07 square kilometres and 1,597 residents. The suburb scores decile 10 on both IRSAD and IEO, the top advantage tier on the most important SEIFA indexes. What sets it apart from other affluent suburbs is the ownership profile: 51% of dwellings are owned outright, higher than most mortgage-belt areas, and 77.8% of homes are separate houses. University qualifications reach 68%, which is 37.9 percentage points above the national figure, pointing to a resident base that is not just wealthy but highly credentialed.
Population
1,597
Median Age
42.0
Household IncomeiMedian weekly household income (ABS Census)
$4,565/wk
DAs (12 months)iDevelopment Applications lodged in the past year
0
Median House
$781K
Estimated from rent (2025)
The median house price sits at $781,000, though this figure is estimated from rental data and likely understates actual transaction values in a suburb where 51% of owners hold property debt-free. Separate houses dominate at 77.8% of the housing stock and 4-plus bedroom homes account for 59.7% of all dwellings, so buyers typically acquire large family properties rather than units. Monthly mortgage repayments average $4,167, producing a mortgage-to-income ratio of 21.1%, which is below the 30% stress threshold despite the high purchase prices, because household incomes run at the 99.8th percentile nationally. Outright ownership outnumbering mortgage holders by 51% to 28.3% reflects a stock held largely by established, long-term owners rather than recent buyers chasing entry into the market.
For Buyers
The median house price sits at $781,000, though this figure is estimated from rental data and likely understates actual transaction values in a suburb where 51% of owners hold property debt-free. Separate houses dominate at 77.8% of the housing stock and 4-plus bedroom homes account for 59.7% of all dwellings, so buyers typically acquire large family properties rather than units. Monthly mortgage repayments average $4,167, producing a mortgage-to-income ratio of 21.1%, which is below the 30% stress threshold despite the high purchase prices, because household incomes run at the 99.8th percentile nationally. Outright ownership outnumbering mortgage holders by 51% to 28.3% reflects a stock held largely by established, long-term owners rather than recent buyers chasing entry into the market.
For Investors
The 20.7% renter share is modest for an inner-Perth suburb, and weekly rent of $440 against a $781,000 median implies a gross yield around 2.9%, low by national averages. The 12.3% vacancy rate is the most significant concern for landlords, running well above normal market equilibrium and signalling more supply than active tenants at current rent levels. Net overseas migration of 304 residents per year supports longer-term demand and population has grown 14% since 2011, but internal migration runs negative at minus 9 per year. Development activity in the past 12 months is zero applications, consistent with a fully established, low-turnover suburb. Investors should weigh yield compression against the suburb's income and education profile, which sustains capital values over time.
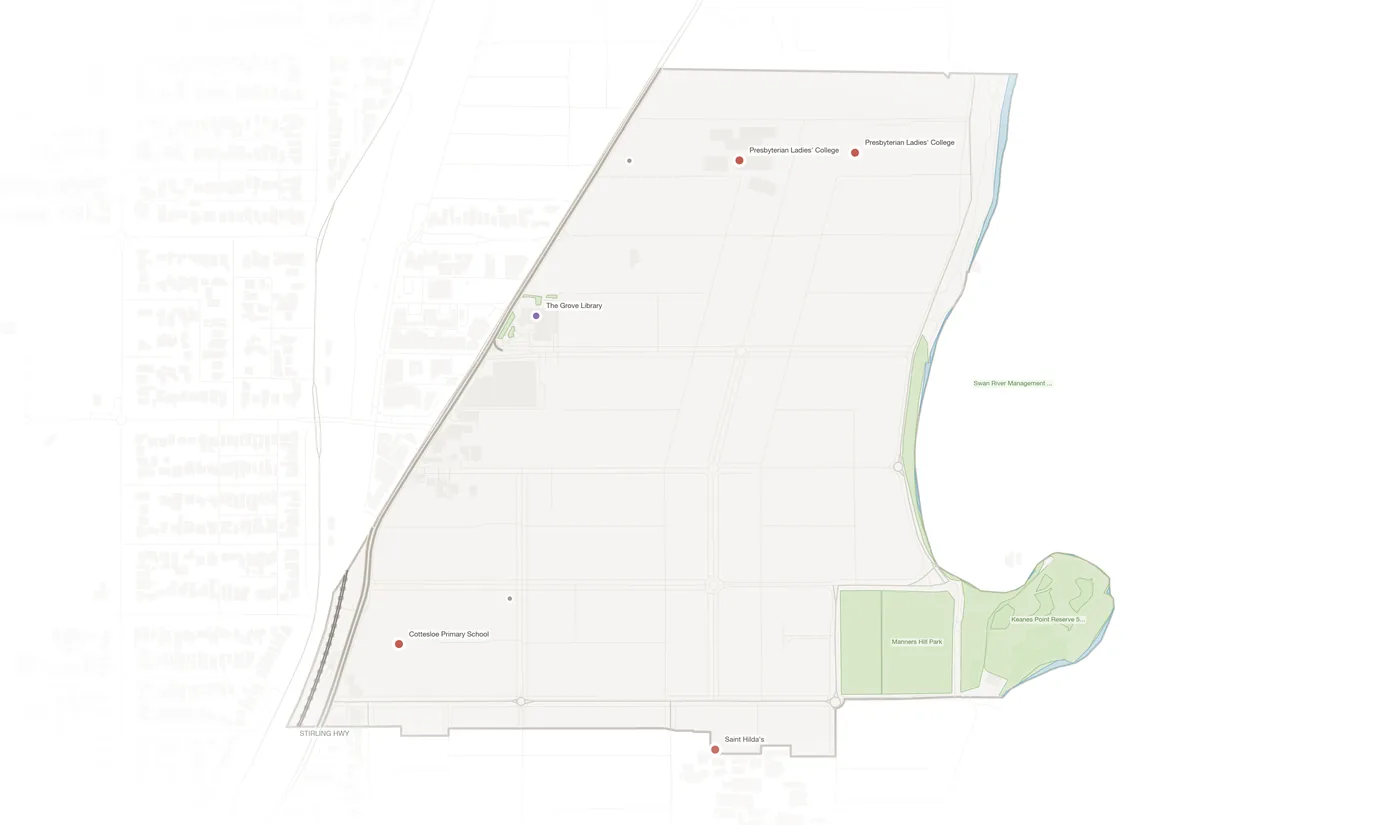
Schools in Peppermint Grove iICSEA: school advantage index. 1000 = national avg, higher = more advantaged
Presbyterian Ladies' College
PP-12 · 963 students
Cottesloe Primary School
K-6 · 351 students
Demographics
The median age of 42 is 2.0 years above the national figure and the trajectory is aging, with the senior share rising 4.2 points over the decade while the working-age cohort fell 2.0 points. Overseas-born residents stand at 28.3%, which is 6.7 points above the national average. Ancestry is predominantly Anglo-Celtic, led by English (704), Scottish (216) and Irish (209). University qualifications at 68% run 37.9 points above national, among the highest concentrations of degree-holders anywhere in Perth. Average household size is 2.7, slightly above the national level. Couples with children make up the single largest family type at 468 households, and one-parent families are effectively absent, consistent with the established-wealth household profile.
Age Distribution
Bedrooms
Dwelling Structure
77.8%
Houses
10.4%
Townhouse
11.8%
Apartment
Tenure
Tenure splits clearly between outright owners (51%) and mortgage holders (28.3%), with renters at 20.7%. Outright ownership exceeding mortgage holders by a significant margin indicates long-held property passed between established households rather than heavy refinancing activity. The stock is 77.8% separate houses, with semi-detached at 10.4% and apartments at 11.8%, making this one of Perth's most house-dominated suburbs at this price point. The bedroom profile skews large: 59.7% of dwellings have 4 or more bedrooms and 24.5% have 3, so sub-3-bedroom properties are rare. Rent-to-income at 9.6% is well below any stress threshold, while mortgage-to-income at 21.1% remains comfortable relative to the 99.8th-percentile household incomes recorded in the data.
Mortgage / mo
$4,167
Rent / wk
$440
HH Size
2.7
Personal Income / wk
$1,501
Vacancy Ratei% of dwellings unoccupied on Census night (ABS 2021)
12.3%
Unoccupied
73
Rent / IncomeiMedian rent as % of household income. Over 30% = housing stress
9.6%
Mortgage / IncomeiMedian mortgage as % of household income. Over 30% = housing stress
21.1%
Community Profile
Ancestry
Household Composition
26.5%
Couples, no children
1,225
Total families
Economy & Employment
Healthcare leads employment at 21.4% of workers (112 people), followed by Professional and Technical services at 19.7% (103) and Finance at 9.4% (49). Education employs 9.0% and Mining 5.9%, reflecting both Perth's resource economy and the suburb's high-income professional base. By occupation, Professionals dominate (280 workers) ahead of Managers (184), together accounting for the vast majority of employed residents. The full-time employment rate is 54.7% and the participation rate reads 56.2%, lower than the income profile might suggest, because 504 residents are not in the labour force at all, consistent with an older, already-retired cohort. Real incomes grew 13.0% over the decade. All four SEIFA deciles sit at 9 or 10, confirming top-tier advantage on education, occupation, and economic resources.
Unemployment
3.7%
Labour Force
6,649
Unemployed
246
Quarterly Trend
Source: SALM Dec-25
Socio-Economic Indexes (SEIFA)iABS index ranking suburbs from 1 (most disadvantaged) to 10 (most advantaged)
Full-time
54.7%
Part-time
40.2%
Participation
56.2%
Employed
707
Occupations
Top Industries
University
68.0%
Postgraduate
18.2%
Born Overseas
28.3%
Dwellings
519
Transport to Work
Car travel is the dominant mode at 78.9% of commuters, above national averages for inner suburbs, while 7.9% walk or cycle and only 6.6% use public transport, modest figures for a suburb within 5 kilometres of the Perth CBD. The suburb scores decile 10 on IRSAD (advantage) and decile 9 on IRSD (disadvantage), placing it in the top tier on both principal welfare indicators nationally. Volunteering reaches 31.9% of residents, substantially above typical suburban rates and reflecting strong social capital within the community. No schools are recorded inside the suburb boundary in this dataset, so families rely on institutions in neighbouring areas. Only 2.9% of residents (45 people) need daily assistance, and housing stress is absent: rent-to-income at 9.6% and mortgage-to-income at 21.1% both sit well below any stress threshold.
Drive
78.9%
Public Transport
6.6%
Walk / Cycle
7.9%
Work from Home
N/A
Population Forecast
+0.82%/yr
(+101 people/yr)
EstablishedPopulation grew 6.3% over the decade and the annual growth rate is running at 0.82%, adding roughly 101 residents per year. Overseas migration is the dominant driver at 304 net arrivals per year, well above the net internal outflow of minus 9 per year. The medium forecast holds Peppermint Grove at approximately 12,231 by 2028 and 12,533 by 2031. The gentrification score of 30 to 31 signals early signs of change, underpinned by 14% population growth since 2011 and accelerating real income growth from 0% to 13% over the period. Affordability improved from 38.7% in 2011 to 28.7% in 2021, meaning housing costs absorbed a lower share of income than a decade prior, a trend that runs against the national direction in most capital city suburbs.
Historical + Forecast
Hamilton-Perry + Holt smoothing on ERP 2001-2025
Age Cohort Forecast
Primary Driver
Overseas Migration
Net Overseas / yr
+304
Net Internal / yr
-9
Gentrification Signal
Early signs
Population +14% since 2011, Strong overseas inflow +304/yr, Accelerating: 0% → 13%
National Ranking iPercentile rank among ~15,000 AU suburbs. 90% = higher than 90% of suburbs
How Peppermint Grove compares to ~15,000 Australian suburbs
Frequently Asked Questions
Is Peppermint Grove a good suburb to live in?
Peppermint Grove ranks in decile 10 on IRSAD and IEO, the top advantage tier nationally, with household income in the 99.8th percentile. University qualifications reach 68%, which is 37.9 percentage points above the national figure. Separate houses make up 77.8% of stock and 51% of owners hold property debt-free, pointing to a stable, long-established residential community.
What is the median house price in Peppermint Grove?
The median house price is estimated at $781,000, derived from rental data. Monthly mortgage repayments average $4,167, and the mortgage-to-income ratio of 21.1% is manageable relative to the suburb's 99.8th-percentile household incomes. Weekly rent averages $440. The 12.3% vacancy rate suggests supply currently exceeds active rental demand.
What schools are in Peppermint Grove?
No schools are recorded inside the Peppermint Grove boundary in this dataset. Families rely on schools in neighbouring suburbs. The local adult population is highly educated, with 68% holding university qualifications, which is 37.9 percentage points above the national average.
Is Peppermint Grove safe?
Crime statistics are not available for Peppermint Grove in this dataset. As an indirect indicator, the suburb scores decile 9 on IRSD (relative disadvantage) and decile 10 on IRSAD, both in the top advantage tiers nationally. Only 2.9% of its 1,597 residents need daily assistance, consistent with a low-disadvantage area.
Is Peppermint Grove good for property investment?
Weekly rent of $440 against a $781,000 median implies a gross yield around 2.9%, below national averages. The 12.3% vacancy rate signals more supply than current demand at prevailing rent levels. However, overseas migration of 304 net arrivals per year and 14% population growth since 2011 support long-term capital demand.
How is Peppermint Grove's population changing?
Population is growing at 0.82% annually, adding roughly 101 residents per year. Over the past decade, the population rose 6.3%. The medium forecast projects approximately 12,533 residents by 2031. Overseas migration drives growth at 304 net arrivals per year, while internal migration is slightly negative at minus 9 per year.
How to read these comparisons
Phrases like "above the national average" reference the unweighted median across Australian suburbs with more than 1,000 residents, not population-weighted national figures. Suburb-level medians are more useful for ranking suburbs against each other; ABS census headlines are population-weighted (so dominated by Sydney and Melbourne) and can read very differently.
Current baseline (refreshed 2026-05-10): median age 40, university-educated 30.1%, born overseas 21.6%, average household size 2.5 people.
Data sources: ABS 2021 Census (demographics, income, tenure), state Valuer-General (house prices), Department of Jobs SALM (unemployment), ACARA (school ICSEA), state Crime Statistics agencies (offences), council DA portals (development applications). Population forecasts use a Hamilton-Perry cohort model calibrated to ABS ERP.
Explore Peppermint Grove on the Map
View parcels, zoning overlays, DA applications, schools and more.
Open Interactive Map