South Kalgoorlie
Mining drives nearly 29% of South Kalgoorlie's workforce, which is why household income sits at the 83rd percentile nationally despite an IRSAD decile of just 5. The suburb holds 4,416 residents across 3.07 km2, producing a density of 1,439 people per km2. The median house price is estimated at $377,000, well below the national median, yet rents have grown 19% over the measured period as the goldfields economy pulls in workers. Separate houses dominate at 83.3% of dwellings, the 16.4% vacancy rate is high by most comparisons, and population has declined 5.3% over the decade, with internal migration running at a net outflow of 332 people per year.
Population
4,416
Median Age
34.0
Household IncomeiMedian weekly household income (ABS Census)
$2,187/wk
DAs (12 months)iDevelopment Applications lodged in the past year
0
Median House
$377K
Estimated from rent (2025)
The estimated median house price of $377,000 sits comfortably below the WA state median, making South Kalgoorlie one of the more accessible entry points for buyers in the Goldfields region. Separate houses make up 83.3% of the stock, with 3-bedroom homes the dominant configuration at 51.6% of dwellings and 4-plus bedroom properties at 32.7%. Monthly mortgage repayments average $1,472, producing a mortgage-to-income ratio of 15.5%, well below the 30% stress threshold. Outright ownership is low at 17.3%, while 45.6% of residents carry a mortgage, reflecting a relatively young ownership profile consistent with the median age of 34, which is 6 years below the national figure.
For Buyers
The estimated median house price of $377,000 sits comfortably below the WA state median, making South Kalgoorlie one of the more accessible entry points for buyers in the Goldfields region. Separate houses make up 83.3% of the stock, with 3-bedroom homes the dominant configuration at 51.6% of dwellings and 4-plus bedroom properties at 32.7%. Monthly mortgage repayments average $1,472, producing a mortgage-to-income ratio of 15.5%, well below the 30% stress threshold. Outright ownership is low at 17.3%, while 45.6% of residents carry a mortgage, reflecting a relatively young ownership profile consistent with the median age of 34, which is 6 years below the national figure.
For Investors
A 37.1% renter share provides a solid tenant base, and weekly rent of $300 reflects a 19% increase over the measured period, indicating genuine demand pressure from mining-sector workers. Against the $377,000 median, that rent implies a gross yield near 4.1%, above typical metropolitan benchmarks. The 16.4% vacancy rate is the sharpest caveat: it signals periodic oversupply when mining cycles soften, and investors should treat it as a lead indicator of cyclical risk. Net internal migration is running at minus 332 per year, which erodes demand when commodity cycles turn. Overseas migration adds 193 residents annually, partly offsetting local outflow. No development applications were recorded in the past 12 months, so new supply is not a near-term competitive threat.
Demographics
The median age of 34 is 6 years below the national figure, and the working-age share has declined 0.5 points over the decade while the senior share rose 3.7 points, placing the suburb on an aging trajectory despite its relative youth. Overseas-born residents represent 28.7% of the population, 7.1 points above the national average. The top ancestries are English (1,338) and Scottish (331), with a notable Maori population of 325, reflecting labour migration patterns tied to the goldfields. Average household size is 2.6, matching national levels. University qualifications stand at just 15.0%, which is 15.1 points below the national figure, consistent with a manual-trades and machinery-operator workforce rather than a knowledge-economy one.
Age Distribution
Bedrooms
Dwelling Structure
83.3%
Houses
15.6%
Townhouse
1.1%
Apartment
Tenure
Tenure splits toward mortgage holders at 45.6%, with renters at 37.1% and outright owners at just 17.3%, a lower outright ownership share than most established suburbs because the population is younger and more transient. The stock is almost entirely separate houses at 83.3%, with semi-detached at 15.6% and apartments a marginal 1.1%. Three-bedroom homes account for 51.6% of dwellings and 4-plus bedroom configurations make up 32.7%, indicating families and shared worker households are the primary occupiers. The rent-to-income ratio is 13.7% and the mortgage-to-income ratio is 15.5%, both comfortably below stress thresholds, because incomes are elevated by mining-industry wages rather than because housing is particularly cheap nationally.
Mortgage / mo
$1,472
Rent / wk
$300
HH Size
2.6
Personal Income / wk
$1,061
Vacancy Ratei% of dwellings unoccupied on Census night (ABS 2021)
16.4%
Unoccupied
301
Rent / IncomeiMedian rent as % of household income. Over 30% = housing stress
13.7%
Mortgage / IncomeiMedian mortgage as % of household income. Over 30% = housing stress
15.5%
Community Profile
Languages Spoken at Home
Ancestry
Household Composition
23.4%
Couples, no children
3,273
Total families
Economy & Employment
Mining employs 28.6% of the local workforce (345 people), the dominant industry by a wide margin compared to the national average where mining accounts for a small fraction. Healthcare follows at 11.3% (136 workers) and Education at 8.4% (101), with Construction at 7.5% and Public Admin at 5.6% rounding out the top five. By occupation, Machinery and Drivers lead at 405 workers, followed by Labourers (259) and Clerical/Admin (241), a profile that reflects the operational character of goldfields work rather than managerial or professional roles. The unemployment rate is 4.4% and the full-time employment rate is 75.9%, above most suburban benchmarks. Real income grew 12.0% over the decade, and household income at the 83rd percentile nationally shows the mining premium flowing through to residents.
Unemployment
2.4%
Labour Force
8,292
Unemployed
199
Quarterly Trend
Source: SALM Dec-25
Socio-Economic Indexes (SEIFA)iABS index ranking suburbs from 1 (most disadvantaged) to 10 (most advantaged)
Full-time
75.9%
Part-time
19.7%
Participation
64.2%
Employed
2,083
Occupations
Top Industries
University
15.0%
Postgraduate
2.4%
Born Overseas
28.7%
Dwellings
1,536
Transport to Work
Car dependency is pronounced at 82.1% of commuters driving, compared to public transport use of just 3.3%, which reflects the regional setting and distance from dense public transport networks. Active transport (walking and cycling) accounts for 4.0% of commuters. No schools are recorded within the suburb boundary in the current dataset, so families rely on institutions in neighbouring areas of Kalgoorlie. The IEO decile of 3 signals below-average education and occupation outcomes relative to the national distribution, while the IRSD decile of 6 places the suburb at moderate advantage on relative disadvantage measures. Housing affordability is real: rent-to-income at 13.7% and mortgage-to-income at 15.5% both sit below stress thresholds, and the volunteering rate of 12.2% indicates an engaged community despite the high population turnover rate of 26.6%.
Drive
82.1%
Public Transport
3.3%
Walk / Cycle
4.0%
Work from Home
N/A
Population Forecast
-0.14%/yr
(-19 people/yr)
EstablishedPopulation has fallen 5.3% over the past decade and the current trend runs at minus 0.14% per year, losing roughly 19 people annually. The medium forecast holds the broader Kalgoorlie area at around 13,750 residents through 2031, confirming slow continued decline rather than a recovery. Internal migration is the structural drag, with a net outflow of 332 people per year driven by the mobility demands of mining-sector workers who leave when conditions change. Overseas migration adds 193 people annually, providing a partial offset. Rent growth of 19% over the period reflects the commodity cycle pushing demand ahead of population headcount. The gentrification score is 0 and the stage is not gentrifying, consistent with an affordable, trade-focused suburb with no signals of income-led transformation.
Historical + Forecast
Hamilton-Perry + Holt smoothing on ERP 2001-2025
Age Cohort Forecast
Primary Driver
Overseas Migration
Net Overseas / yr
+193
Net Internal / yr
-332
Gentrification Signal
Not gentrifying
Net internal outflow -332/yr
National Ranking iPercentile rank among ~15,000 AU suburbs. 90% = higher than 90% of suburbs
How South Kalgoorlie compares to ~15,000 Australian suburbs
Frequently Asked Questions
Is South Kalgoorlie a good suburb to live in?
South Kalgoorlie offers genuine affordability, with a $377,000 median house price and mortgage-to-income at 15.5%, well below stress thresholds. Household income sits at the 83rd percentile nationally due to mining-sector wages. Trade-offs include the IRSAD decile of 5, limited public transport at 3.3%, and a population decline of 5.3% over the decade.
What is the median house price in South Kalgoorlie?
The median house price is estimated at $377,000 (2025 estimate derived from rent data). Weekly rent averages $300, up 19% over the measured period. Monthly mortgage repayments average $1,472, giving a mortgage-to-income ratio of 15.5%, which is well below the 30% stress threshold.
What schools are in South Kalgoorlie?
No schools are recorded within the South Kalgoorlie suburb boundary in this dataset. Families rely on schools in the broader Kalgoorlie-Boulder area. The local university qualification rate is 15.0%, which is 15.1 points below the national figure, reflecting the trade and mining workforce composition.
Is South Kalgoorlie safe?
Crime statistics specific to South Kalgoorlie are not available in this dataset. As a contextual indicator, the suburb scores IRSD decile 6, placing it at moderate advantage on relative disadvantage nationally. The unemployment rate is 4.4% and housing stress measures are low, with rent-to-income at 13.7%.
Is South Kalgoorlie good for property investment?
A 37.1% renter share and weekly rent of $300 against a $377,000 median implies a gross yield near 4.1%, above most metropolitan benchmarks. The 19% rent growth period is a positive signal, but the 16.4% vacancy rate and net internal outflow of 332 people per year are material risks tied to mining cycle volatility.
How is South Kalgoorlie's population changing?
Population has declined 5.3% over the past decade and the current annual trend is minus 0.14%, losing around 19 residents per year. Net internal migration runs at minus 332 people annually, while overseas migration adds 193. Medium forecasts project continued slow decline through 2031, with the broader area settling near 13,750 residents.
How to read these comparisons
Phrases like "above the national average" reference the unweighted median across Australian suburbs with more than 1,000 residents, not population-weighted national figures. Suburb-level medians are more useful for ranking suburbs against each other; ABS census headlines are population-weighted (so dominated by Sydney and Melbourne) and can read very differently.
Current baseline (refreshed 2026-05-10): median age 40, university-educated 30.1%, born overseas 21.6%, average household size 2.5 people.
Data sources: ABS 2021 Census (demographics, income, tenure), state Valuer-General (house prices), Department of Jobs SALM (unemployment), ACARA (school ICSEA), state Crime Statistics agencies (offences), council DA portals (development applications). Population forecasts use a Hamilton-Perry cohort model calibrated to ABS ERP.
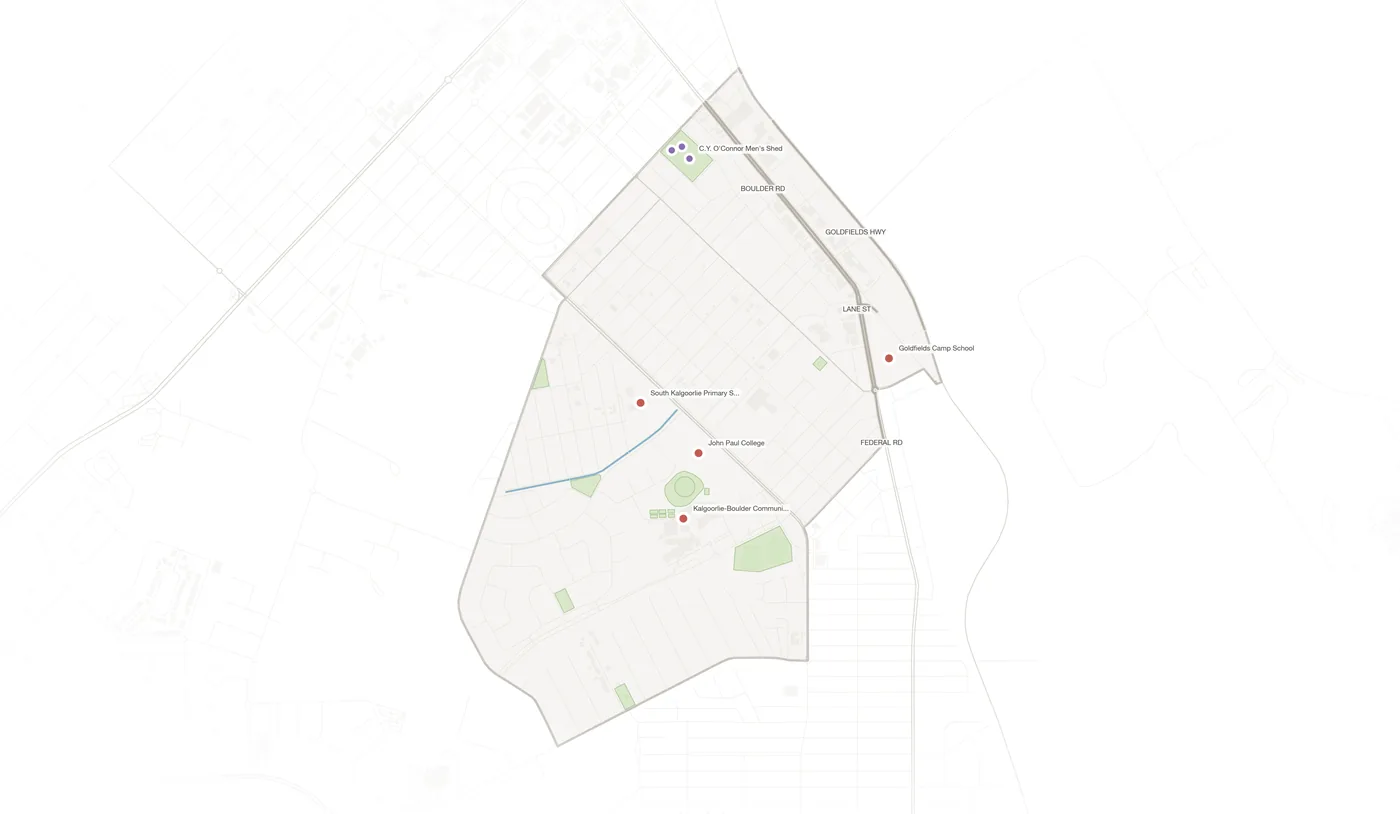
Explore South Kalgoorlie on the Map
View parcels, zoning overlays, DA applications, schools and more.
Open Interactive Map