
Most site constraints cost you studies. Grid distance costs you steel. Every kilometre between a candidate site and the nearest connectable transmission asset is easement negotiation, towers and conductor, priced per kilometre and committed before the project earns a dollar. Zoning problems can sometimes be argued and receptor problems designed around, but distance to network goes straight into the capital stack and moves it by millions on its own. That is why transmission proximity is the first filter in any renewable site screen: the cheapest question to ask and the most expensive one to get wrong.
It is also the filter people most often over-read. A 330 kV circuit along your fence line tells you the network is physically there. It tells you nothing about whether that corner of the network can absorb your megawatts, how congested it is, or how many projects sit in the connection queue ahead of you. Those are questions for AEMO's planning documents and the network operator's connection team, and no spatial dataset answers them. Proximity screening is necessary. It is nowhere near sufficient.
What it cannot answer: whether you can connect a given capacity, when, and at what cost. That is a connection enquiry with the network operator under the National Electricity Rules, informed by AEMO's system planning. Any spatial screen, ours included, is the filter before that conversation, never a substitute for it.
Where the transmission data actually lives
The dataset almost every Australian proximity screen ultimately rests on, including ours, is Geoscience Australia's Foundation Electricity Infrastructure product, part of the Foundation Spatial Data Framework. It bundles three national layers: Electricity Transmission Lines, Transmission Substations and Major Power Stations. It is free, national, and queryable programmatically from Geoscience Australia's ArcGIS REST services.
Two fields do most of the screening work:
- CAPACITYKV carries the line voltage, from 11 kV up to 500 kV. This is the field that separates a rural distribution feeder from bulk transmission; a screen that ignores it will happily call a dairy shed's powerline "grid access".
- OPERATIONALSTATUS distinguishes operational assets from ones still being built. It works, with lag. Our own extract around Wagga Wagga shows a 500 kV line named "Dinawan to Wagga Wagga" marked Under Construction: that is the eastern section of TransGrid's Project EnergyConnect, the 900 km interconnector between the South Australian, NSW and Victorian grids, landing at a brand-new substation at Dinawan. New builds do appear, with the status field trailing the construction schedule; confirm anything under construction against the proponent's own project page.
What the dataset does not carry is everything commercial: thermal ratings, hosting capacity, constraint behaviour, connection queue position. For the capacity side, the reference document is AEMO's Integrated System Plan for the National Electricity Market; the 2026 ISP is the current edition, and its Renewable Energy Zones appendix is where the "build here, the network can take it" thinking lives. AEMO also publishes network status and congestion information for the operational picture. One dead end worth naming: older guides still point to the Network Opportunity Maps on the AREMI portal, but AREMI and its successor NationalMap have been decommissioned (NationalMap in mid-2025), so those links no longer resolve.
When a site survives screening, the actual answer comes from the network operator: TransGrid's connections process in NSW, with every transmission business running an equivalent. The spatial data gets you to that conversation with the right shortlist; it does not replace it.
Two real screens: 17 metres versus 252 metres
Abstract advice is cheap, so here are two parcels our production screening engine ran in July 2026: real cadastral lots in the NSW Riverina, screened as demonstrations. Neither is a client project and nothing is proposed on either piece of land.
The first is a 391 ha irrigated farmland parcel on O'Neil Road, Darlington Point, in the Murrumbidgee Council LGA, screened for a solar farm. The national dataset puts a 330 kV transmission line 17 metres from its boundary. That is not a typo: the line runs visibly along the eastern edge of the parcel.
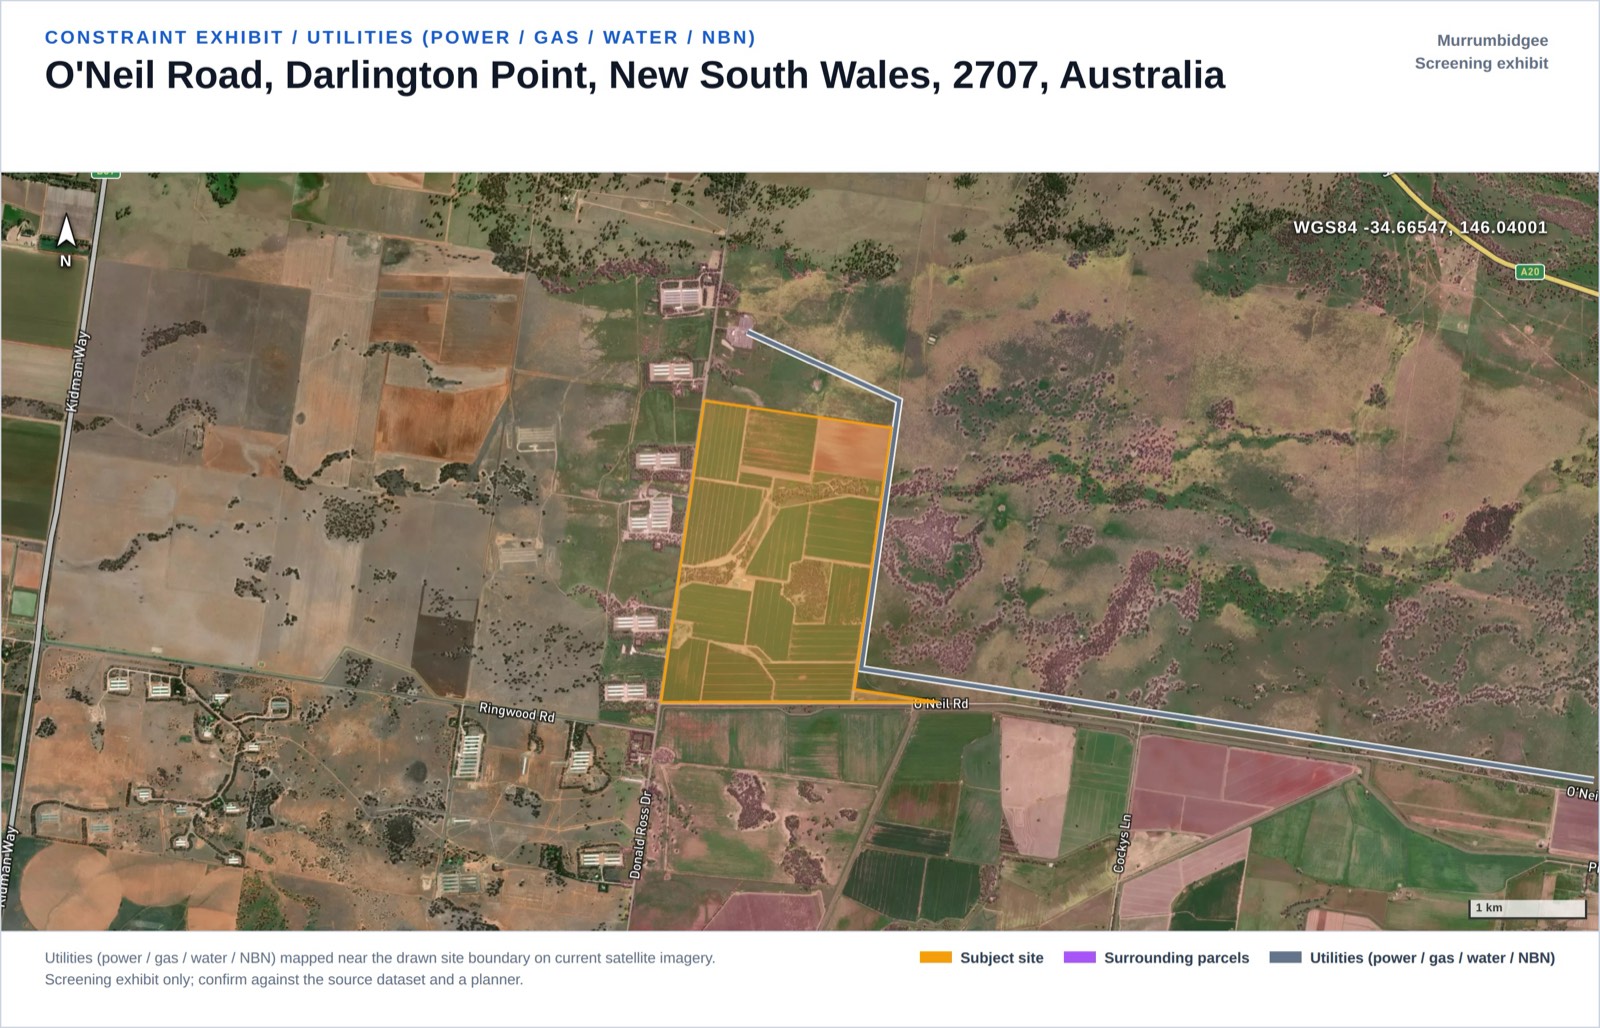 Utilities exhibit from the screening report our engine generated on the Darlington Point parcel (Lot 161 DP821551). A screening demo on a real lot, not a proposal for this land.
The second is a 20.4 ha parcel on Gregadoo East Road in the Wagga Wagga City Council LGA, screened for a battery energy storage system. Same 330 kV network, but here the nearest line sits 252 metres away.
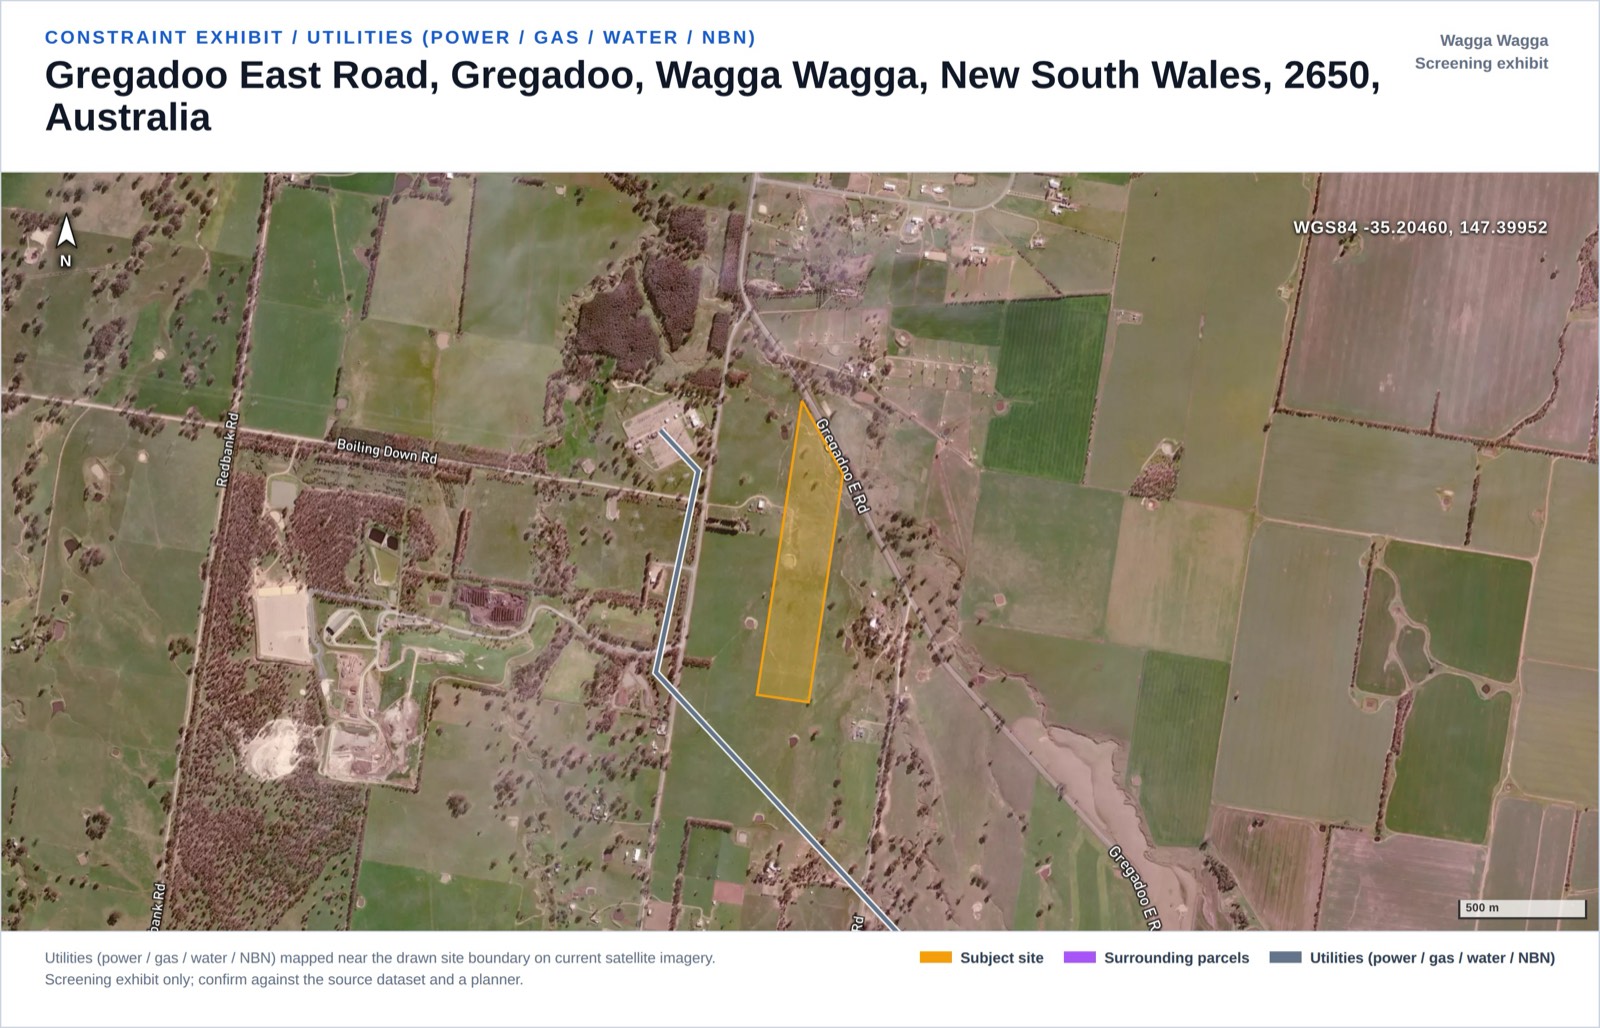 The same exhibit from the Gregadoo BESS screening demo (Lot 61 DP757231). Again, a real parcel used to demonstrate the screen, nothing more.
Side by side, from the two reports:
| Darlington Point solar demo | Gregadoo BESS demo | |
|---|---|---|
| Parcel | Lot 161 DP821551, 391 ha | Lot 61 DP757231, 20.4 ha |
| Zone | RU1 Primary Production | RU1 Primary Production |
| Nearest transmission line | 330 kV, 17 m from boundary | 330 kV, 252 m away |
| Risk score (lower is better) | 34/100, workable with conditions | 44/100, workable with conditions |
| Findings mix | 0 major, 1 moderate, 8 minor, 8 insignificant, 2 pending | 0 major, 2 moderate, 9 minor, 6 insignificant, 2 pending |
| Nearest dwelling | 898 m (5 dwellings within 2 km) | 320 m (49 dwellings within 2 km) |
| What else the screen found | Murrumbidgee Valley conservation area 5.9 km away; mean slope 0.3% | Mapped bushfire area (Vegetation Category 3); BESS thermal-runaway hazard profile; mean slope 1.8% |
| Gas pipeline | None within 20 km | None within 20 km |
Notice what did not happen: the parcel with the line 17 metres away did not "win" because of it. Both sites get grid access rated as an enabling opportunity rather than a constraint, because at 330 kV both are close. The ten-point difference in risk score comes from everything else: the Gregadoo parcel sits in a mapped bushfire area, carries a battery-specific thermal-runaway hazard profile, and has 49 dwellings within 2 km against Darlington Point's 5. Proximity got both sites through the first filter. The rest of the screen separated them.
The trap: a line across your parcel is a constraint, not a bonus
There is a persistent instinct, especially among landholders pitching their own land to developers, that a transmission line crossing the property is the jackpot. It is usually the opposite.
Neither demo parcel has a mapped crossing, yet both reports still flag the same follow-up: a transmission line within 500 metres implies a registered easement corridor nearby, and easements are not reliably desktop-verifiable. The register is the truth, which is why both reports put a Certificate of Title order (about a week through the state land registry) at the top of the next-steps list. The ideal geometry is the Darlington Point situation: the line at the fence, the easement burden on someone else's title.
A substation next door is not the same question
Line proximity and substation proximity get conflated constantly, and the national data shows why they should not be. Pull the substations and power stations around Wagga Wagga from the same dataset and you get 14 mapped facilities. That sounds like a connection buffet until you read the voltage classes: of the 40 line segments mapped in the same pull, 20 run at 66 kV and 16 at 132 kV. Those feed zone substations, the distribution workhorses that step power down for the town: Bomen, Kooringal, Ashmont, Forest Hill and their siblings. They are the wrong voltage class for utility-scale connection, and a 66 kV zone substation over your fence does not make a 200 MW project connectable there.
The transmission-level asset in that entire picture is one facility: Wagga 330, where the three operational 330 kV circuits in the extract converge (towards Jindera, Lower Tumut and Darlington Point) and where the under-construction 500 kV EnergyConnect line lands. One anchor, thirteen decoys. A data honesty note: the dataset's own class field labels even Wagga 330 as a "Zone" substation, so you cannot lean on that attribute alone. You identify the transmission asset by the voltage of the lines terminating at it, not by the label on the point.
Substation connections and mid-span tee-ins are also different engineering exercises with different network implications; which suits a given project belongs in a connection study, not a spatial screen. What the screen owes you is the honest inventory: which nearby assets are transmission class, which are distribution, and how far each actually is.
Where proximity fits in a full screen
In our energy site screening memo, grid proximity is one constraint of 19, alongside zoning, overlays, ecology, bushfire, flooding, heritage, receptors and the rest. The two Riverina demos show why the other 18 exist: both parcels pass the proximity filter easily, and both still came back "Indeterminate - key data missing" rather than a green light. In NSW the Aboriginal heritage register (AHIMS) is access-restricted, and council flood mapping covers only part of the state, so both reports carry two PENDING constraints that are explicitly not counted as low risk. A screen that quietly scored missing data as safe would be more comforting and less useful; ours prints the gap and names the check that closes it. Data completeness on both demo reports: 89%, and the reports say so.
The screen itself is a desktop exercise: A$1,000 per site for the pilot, one business day, 19 constraints with sources and required checks per finding. It is not planning advice and does not replace your planner, ecologist or connection engineer; it exists so they spend their hours on sites that deserve them. Read a full sample report at /report/energy-tailem-bend-demo, eyeball zoning, overlays and parcels for any address free on our map, or hit the property API sample if you would rather consume the same layers as data.
FAQ
Where can I get transmission line data for Australia? Geoscience Australia's Foundation Electricity Infrastructure product, part of the Foundation Spatial Data Framework: transmission lines, transmission substations and major power stations in three national layers, free through the GA product catalogue and ArcGIS REST services. It is the same dataset our screening engine queries.
Does the national dataset include voltage? Yes. The transmission lines layer carries a CAPACITYKV field with the line voltage from 11 kV to 500 kV, plus an OPERATIONALSTATUS field distinguishing operational assets from those under construction. Voltage is what separates genuine transmission from distribution feeders, so read it rather than just measuring distance to the nearest line.
Can transmission data tell me whether my site can actually connect? No. Spatial data answers where the network is; hosting capacity, congestion and queue position are AEMO and network operator territory, starting with AEMO's Integrated System Plan and ending in a formal connection enquiry with the transmission business. Treat proximity as a cost proxy and a shortlisting filter, not a connection answer.
Is a transmission line crossing my land good for a renewable project? Usually the opposite. A crossing means a registered easement with asset-owner building setbacks (typically 30 to 60 metres in our screening logic) that sterilise a strip of the buildable envelope, which is why our screen escalates crossings to a MODERATE finding. The best geometry is a line near the boundary: close enough to connect, with the easement burden on the neighbouring title.
How close to transmission does a site need to be? There is no universal threshold, because distance converts to connection cost rather than a pass or fail. In our two Riverina screening demos, parcels 17 m and 252 m from 330 kV lines both had grid access rated as an enabling opportunity, and the site ranking was decided by receptors, bushfire and hazard profile instead.
Do new transmission lines show up in the data before they are finished? Yes, with lag. Our extract shows the 500 kV Dinawan to Wagga Wagga line, part of TransGrid's Project EnergyConnect, mapped and marked Under Construction in the national dataset. Confirm the status and timing of any under-construction asset against the proponent's official project information before relying on it.
What is the difference between a zone substation and a transmission substation? Zone substations step power down to distribution voltages that supply local customers; transmission substations are where bulk circuits (220 kV and above) interconnect. Of 14 mapped facilities around Wagga Wagga in the national dataset, only Wagga 330 is a transmission-level connection point, so count line voltages at the substation rather than trusting proximity or labels.


