Solutions // Data Centre Site Screening

Planning red flags for data centre sites.

A planning and environment screening memo for data centre candidates anywhere in Australia. 19 constraints checked against public spatial data: zoning, easements crossing the parcel, native grassland and other ecology triggers, heritage, flood, bushfire and receptor separation. The filter you run before spending real money on consultants, not a substitute for them.
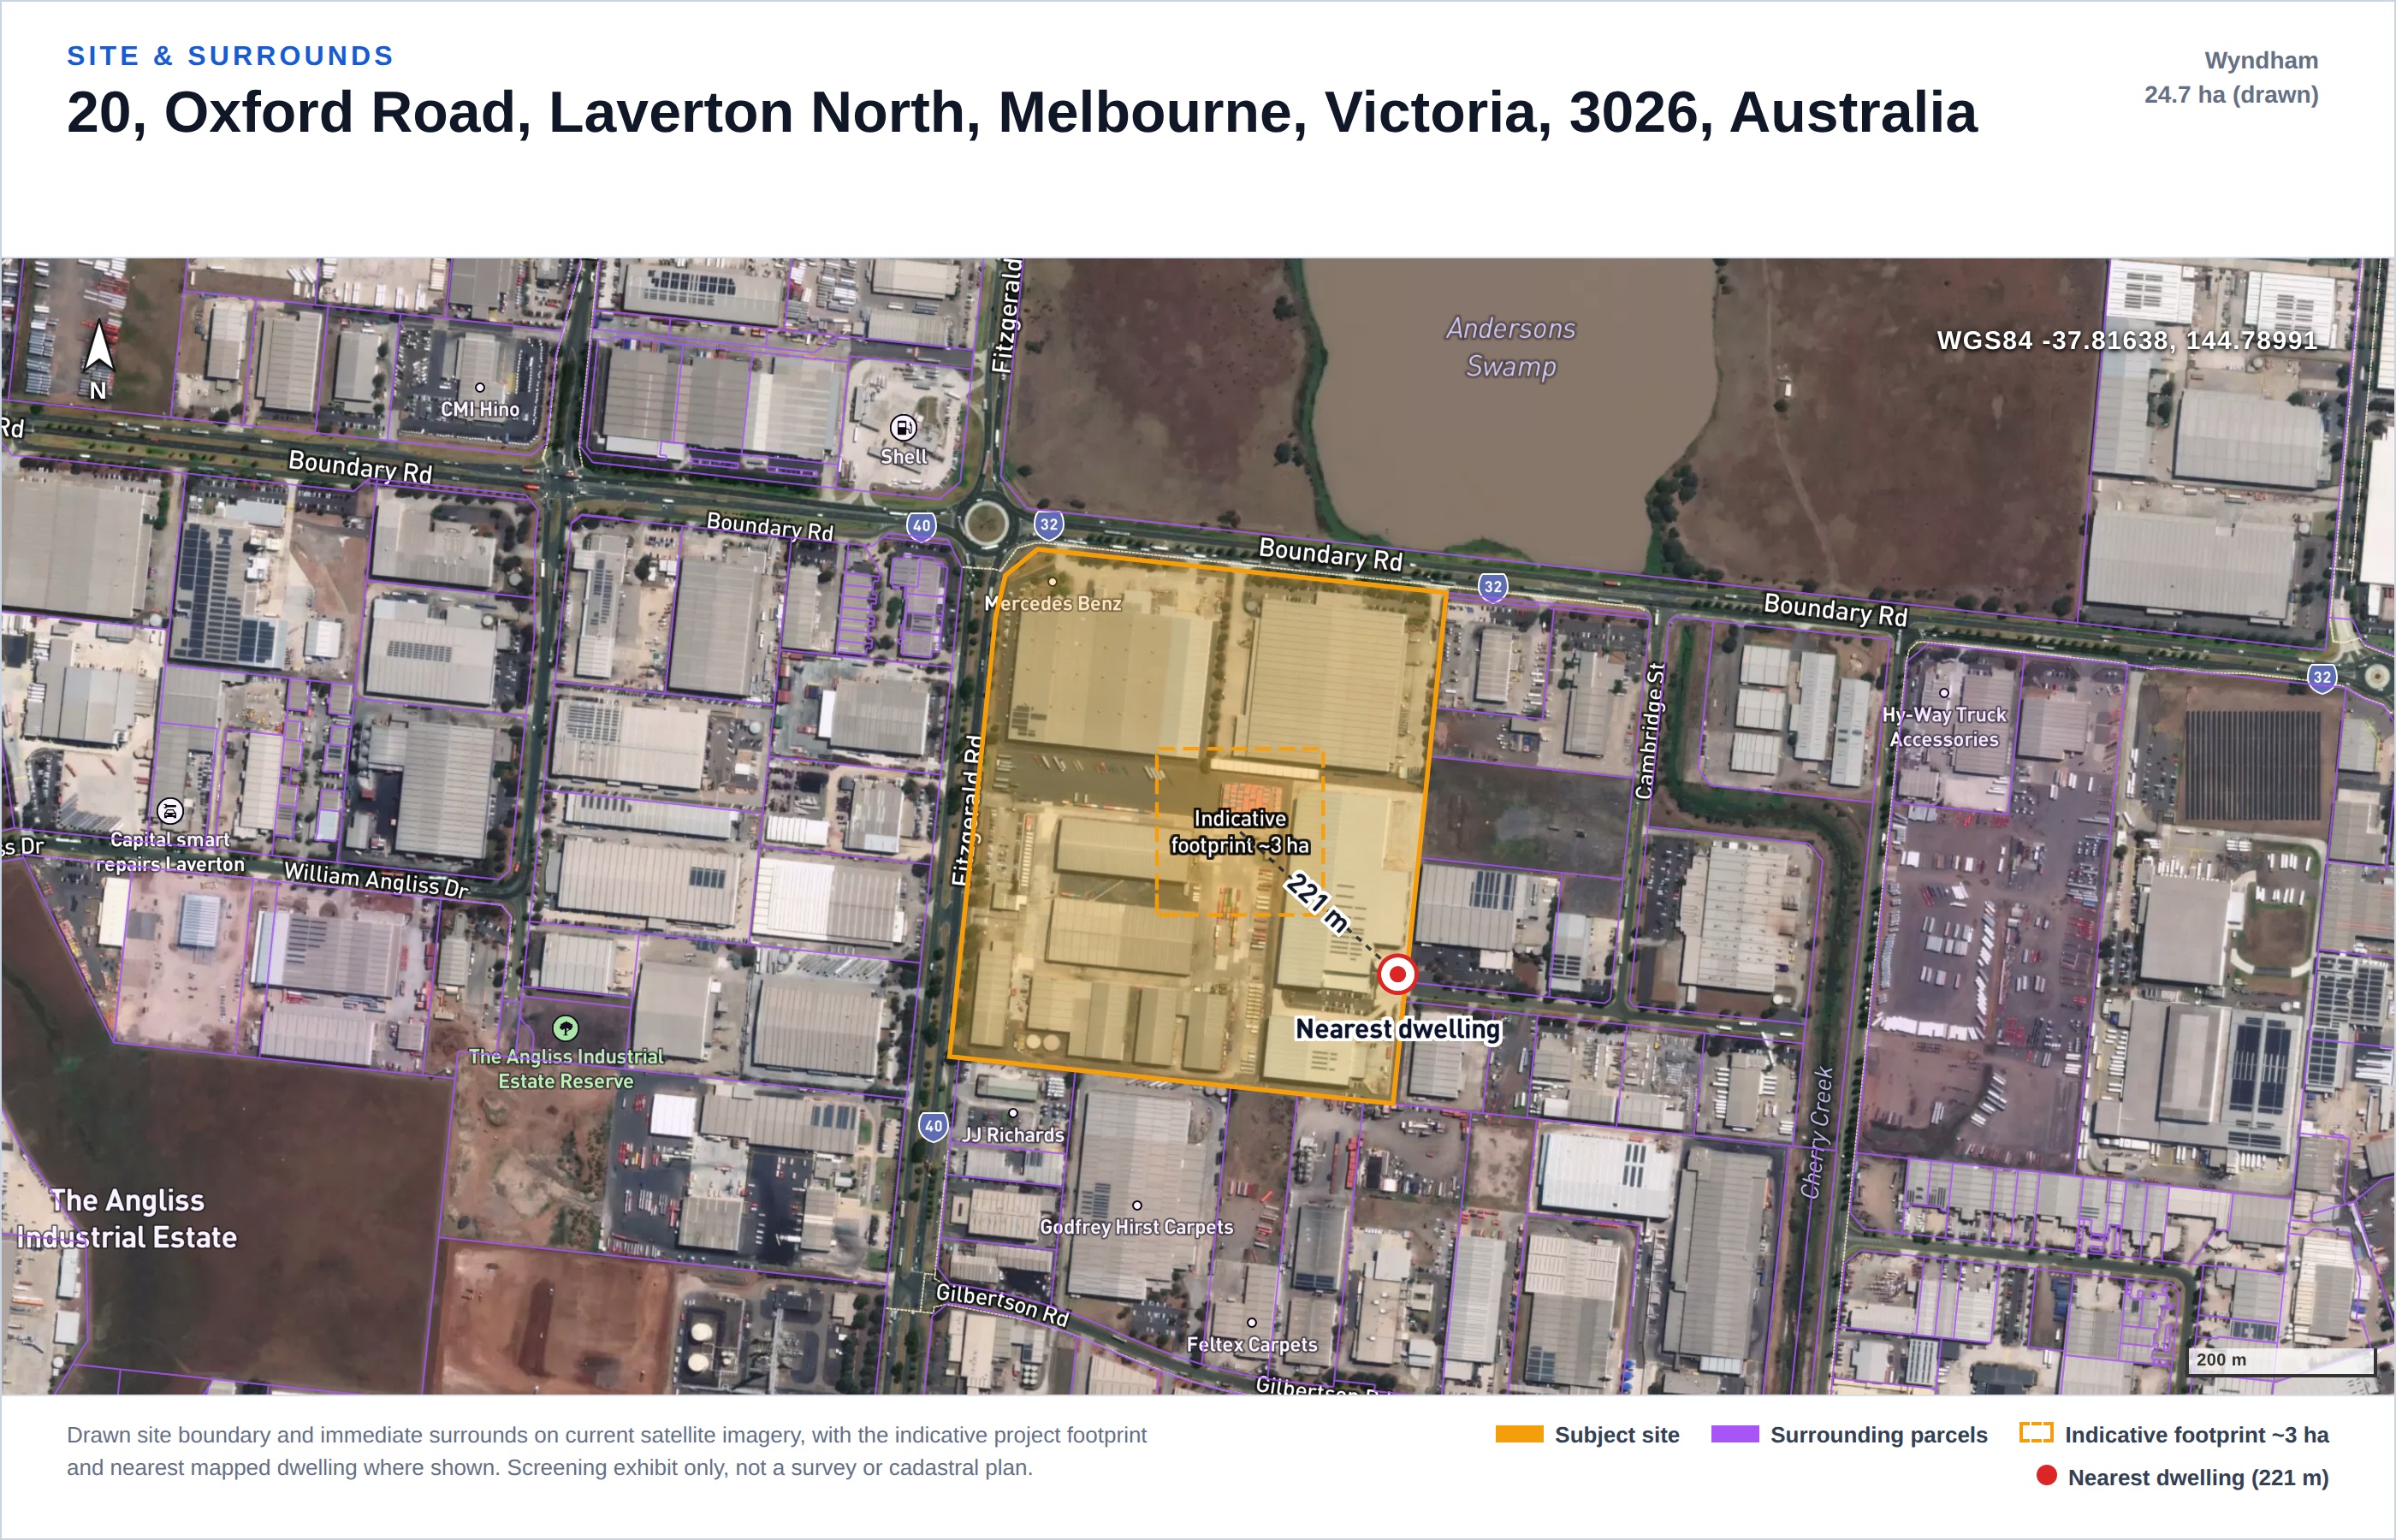
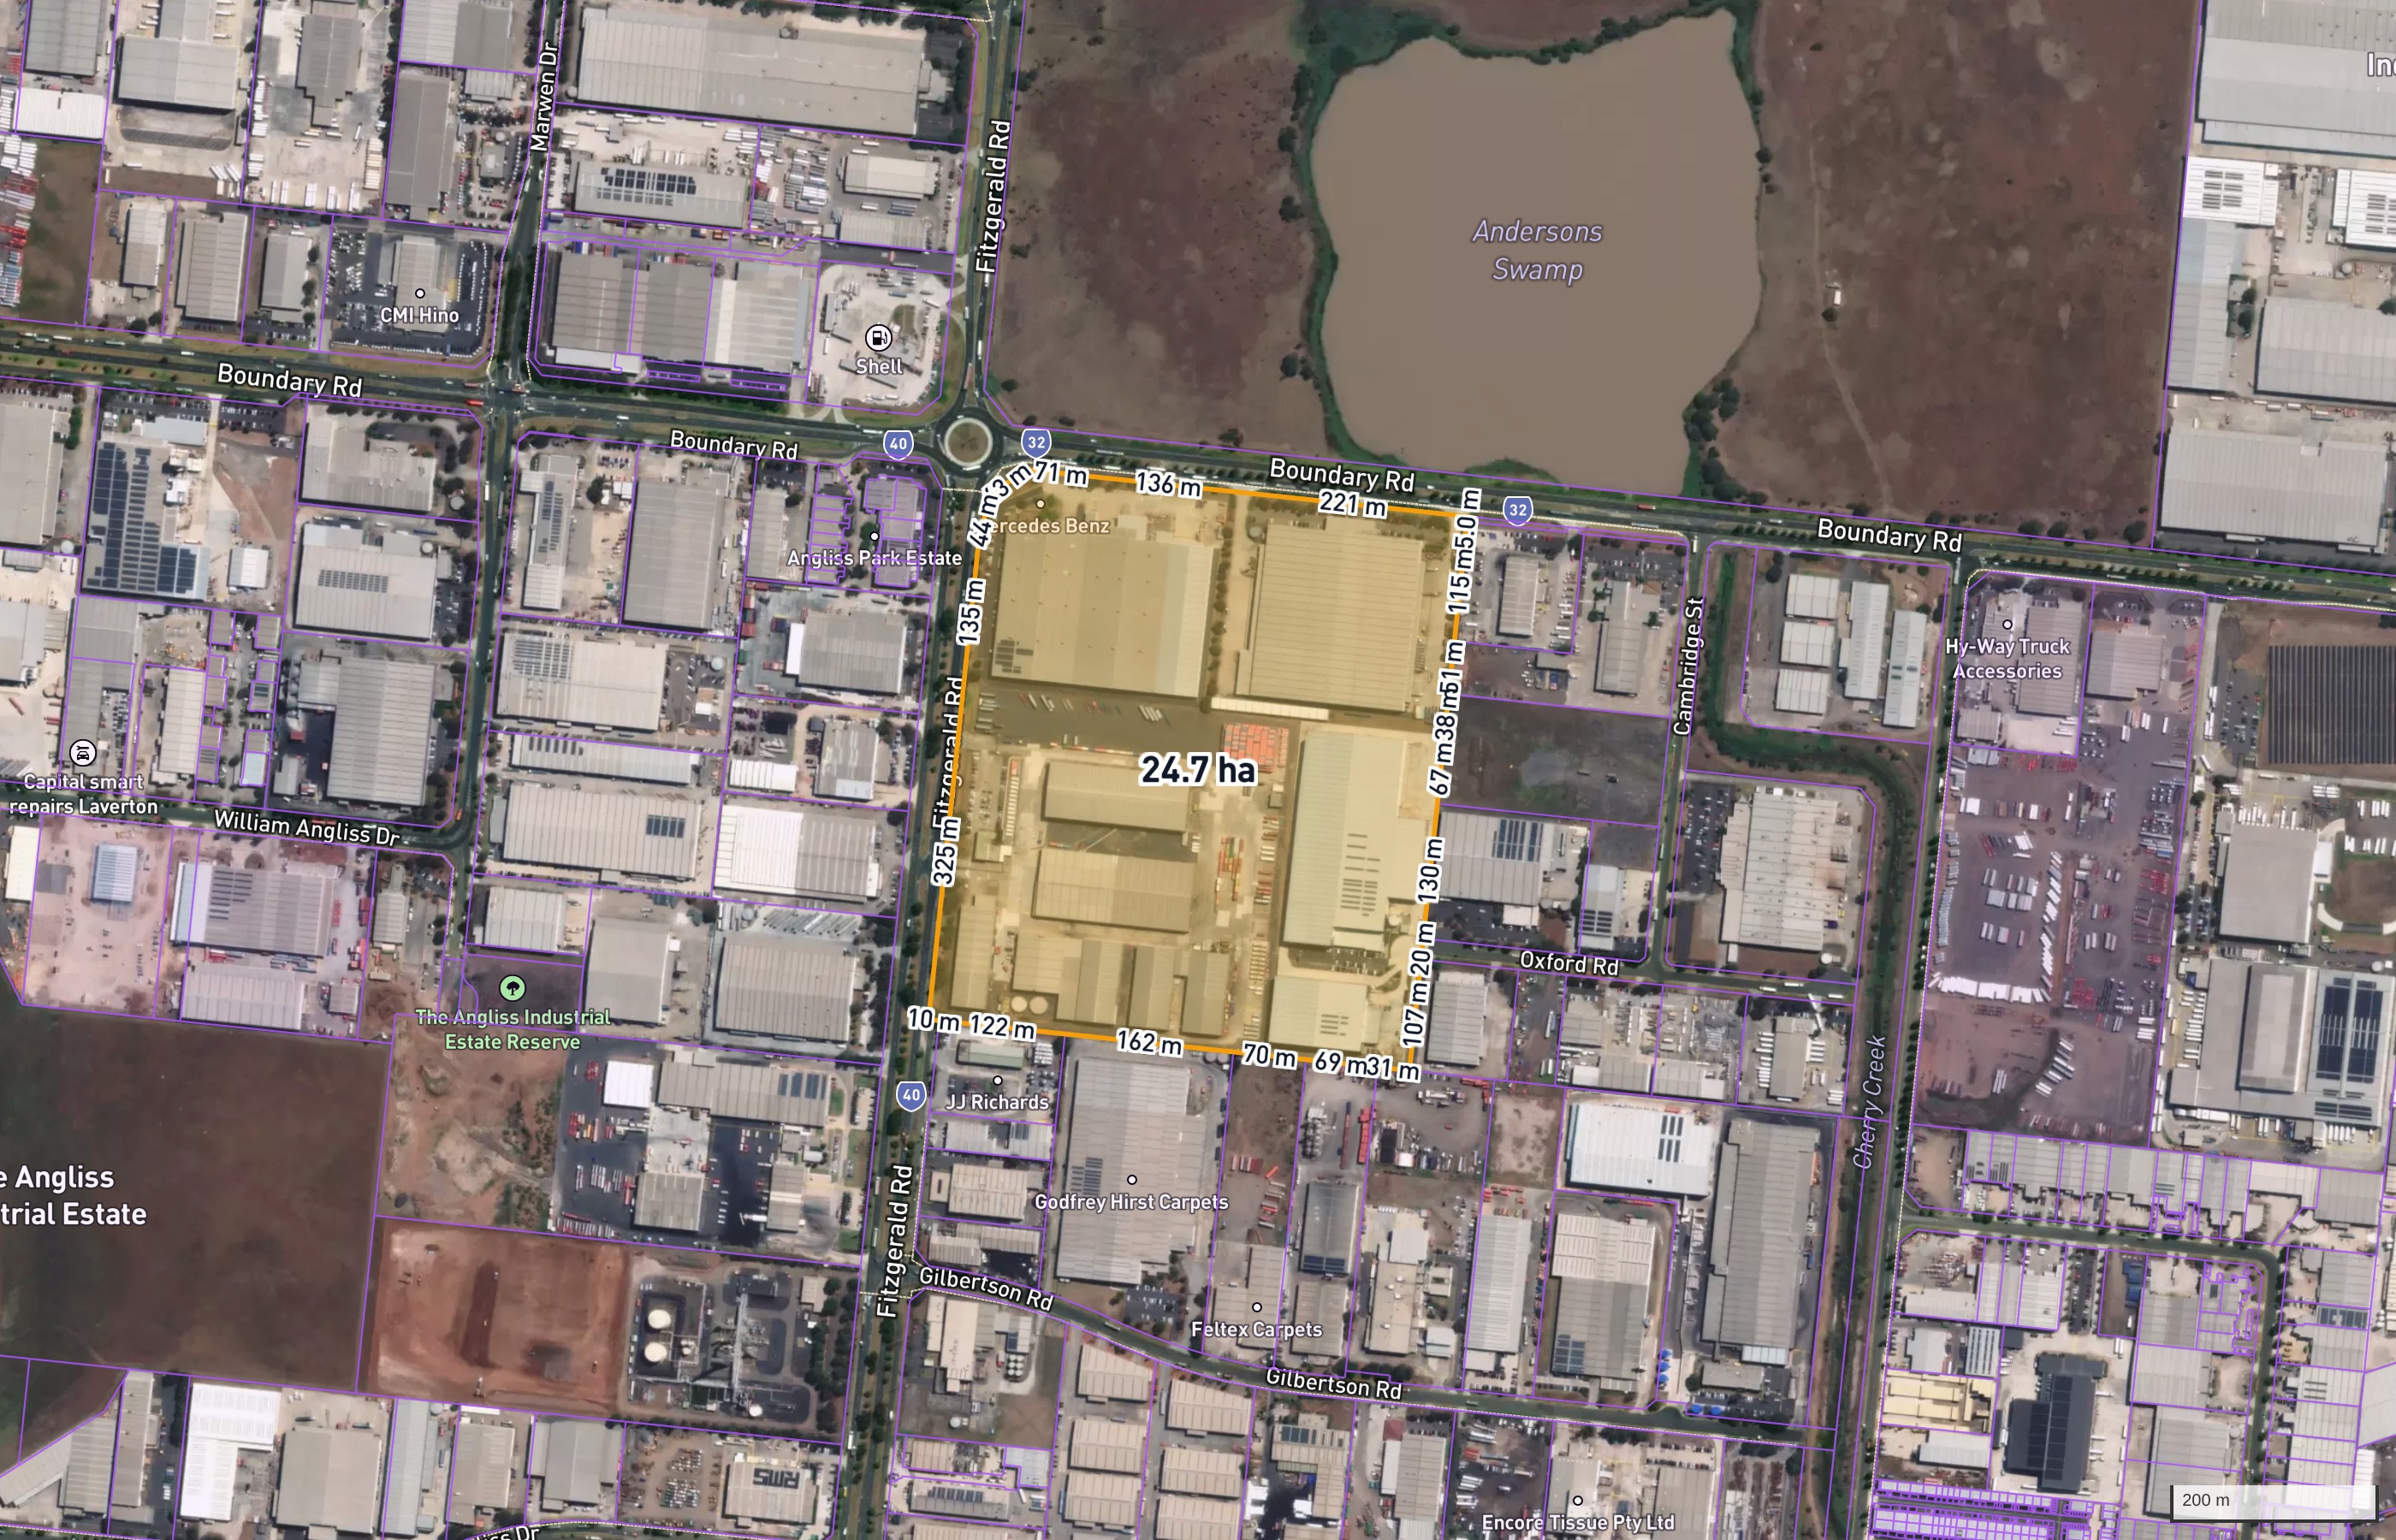
Sample screening report: site and surrounds satellite figure, Laverton North VIC industrial parcel
Sample verdict
No fatal flaws identified
4 moderate · risk score 44/100 · data 100%
Re
Data Centre Site Decision Memo
Project
Laverton North Data Centre Screening (demo) · Data Centre
Site
20, Oxford Road, Laverton North, Melbourne, Victoria, 3026, Australia · 24.7 ha
Council / State
Wyndham · VIC

The Evidence

One real sample. Every line below is from it.

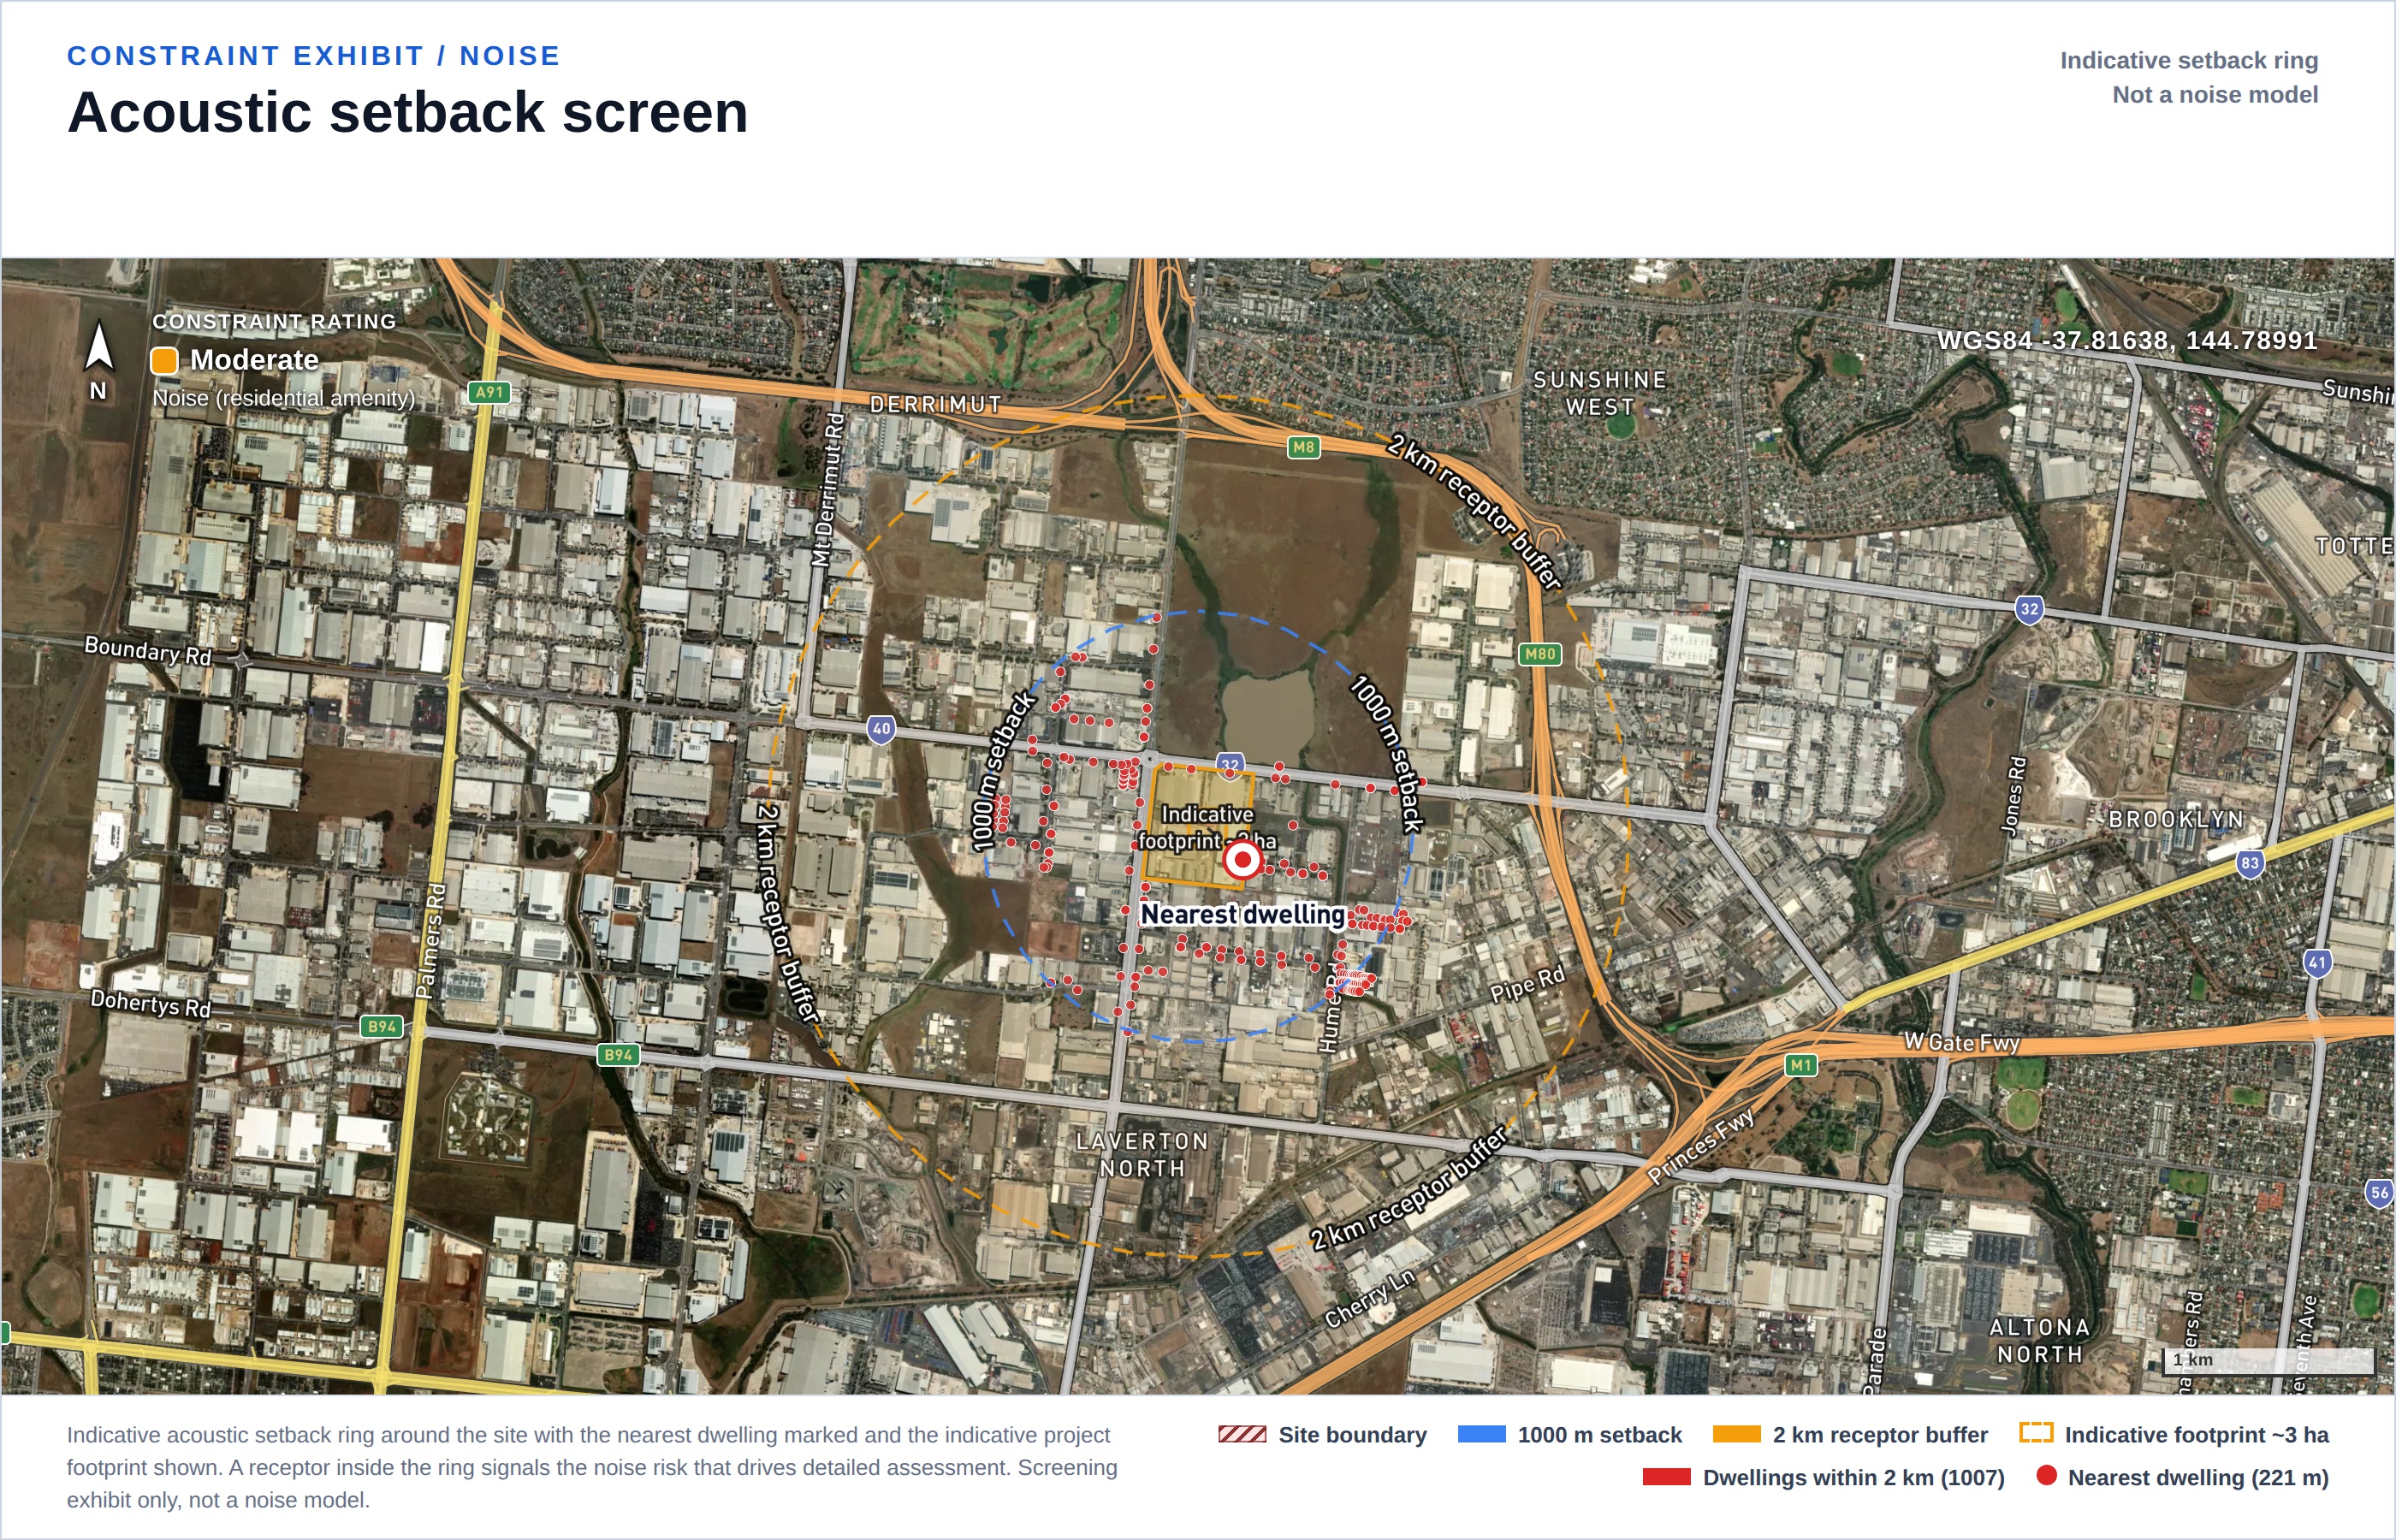
This is the actual constraint table of the sample report: a 24.7 ha industrial-zoned parcel in Laverton North, in Melbourne's west. Each row carries its own rating and a separate data status, and in the full report each becomes a section with statutory references and sources. The screen found what really shapes data centre siting in this corridor: an infrastructure easement crossing the parcel, a native grassland reserve 39 m away with the ecology and EPBC questions that follow, and the nearest dwelling close enough to make cooling-plant noise a real assessment item.

Zoning insignificant assessed · clean
Cadastral / Title & Easements moderate assessed · hit
Planning Overlays insignificant assessed · clean
Aboriginal Heritage minor assessed · hit
Historic / Federal Heritage insignificant assessed · clean
Bushfire insignificant assessed · clean
Flora & Fauna / Ecology moderate assessed · hit
EPBC / Matters of National Significance moderate assessed · hit
Hydrology / Flooding insignificant assessed · clean
Noise (residential amenity) moderate assessed · hit
Visual Amenity minor assessed · hit
Contours / Topography insignificant assessed · clean
Geotechnical minor data limited
Soils insignificant assessed · clean
Utilities (power / gas / water / NBN) insignificant assessed · hit
Traffic & Access minor data limited
Contaminated Land insignificant assessed · clean
Air Quality minor assessed · hit
Hazard & Risk (fire / explosion) minor assessed · hit
major — potential fatal flaw moderate — needs mitigation minor — readily mitigated insignificant pending — data unavailable, disclosed as such
Site and surrounds satellite exhibit with indicative footprint
Site & surrounds exhibit
Constraint context map exhibit
Constraint context exhibit
Noise receptor separation exhibit: dwellings around the site
Receptor separation exhibit
Full sample report Sample PDF

Power & Cluster

Power at the fence, and the cluster you would join.

A data centre lives or dies on power. Every report leads with the grid: the nearest high-voltage transmission and the substations that would feed the site, then the existing data centres nearby — the fibre and power ecosystem you inherit by clustering.

220 kV
highest-voltage station nearby (Altona Terminal Station, 2,480 m)
HV transmission crosses or adjoins the sample site (66 kV), 14 substations within 6 km.

Substations that could feed the site

  • Laverton North Zone Substation · 66 kV · 1,283 m
  • OneSteel Customer Substation · 66 kV · 1,874 m
  • AirTrunk Data Substation · 66 kV · 2,329 m
  • Altona Terminal Station · 220 kV · 2,480 m
  • Altona Chemical Zone Substation · 66 kV · 3,352 m

Presence, distance and nominal voltage from OpenStreetMap and the drawn boundary. Firm connection capacity and augmentation cost are a network connection study, not a desktop fact, and the report says so.

Existing data-centre cluster

13 data centres mapped within 8 km — the fibre, power and peering ecosystem you inherit by clustering.

  • CDC Laverton · 3,091 m
  • Equinix ME4 · 3,127 m
  • Stack Infrastructure MEL01A · 3,777 m
  • Stack Infrastructure MEL01B · 3,798 m
  • Amazon Web Services · 3,882 m

OpenStreetMap labels, quoted as-is.

Not in this block

  • Firm grid capacity: how many MW you can actually connect is a network study
  • Fibre backbone: carrier routes and availability are not in our data
  • Water for cooling: a utility enquiry we do not model

The report is honest about where the desktop ends.

How It Works

Send a site. Get a memo back.

No software to adopt, no seats, no onboarding. It slots in front of your existing consultant workflow as an early filter.

01

Send one candidate site

An address, coordinates or a boundary file. That is all we need to start.

addresscoordinatesKML / GeoJSON
02

We run the desktop screen

19 constraints against state and federal spatial data: zoning, overlays, easements, bushfire, flooding, EPBC, heritage, soils, transmission proximity and more. Ratings are weighted for a data centre; standby diesel storage and continuous cooling-plant noise are assessed as what they are, not borrowed from a power-station template.

statutory referencesdata centre weighting
03

Memo + PDF, fast turnaround

An overall verdict, per-constraint ratings and data status, satellite exhibits, comparable approved data centre projects, and the recommended next checks for anything a desktop screen cannot close out.

verdictsite risk scorenext steps

Honest by Design

What this screen is, and what it is not.

19
constraints, two fields each
every constraint carries a rating AND a separate data status, so a gap in public data is disclosed as pending, never dressed up as clean

Two things we do not have, said plainly

Grid hosting capacity. The screen measures spatial proximity to transmission and distribution infrastructure from the national dataset, including lines that cross the parcel and the easement setbacks they carry. It does not know how many megawatts the network can actually deliver to the site or when: that is a connection enquiry with the network operator, and no public spatial layer answers it.

Fibre routes and latency. We hold no carrier duct or dark-fibre route data. If connectivity is on your critical path, that diligence sits outside this screen and we will not pretend otherwise.

What the screen does close out early, from public data:

  • Zoning and overlays: is the use even open to you here, and what schedules apply
  • Easements crossing the parcel: corridors that sterilise part of the buildable envelope
  • Ecology and EPBC: native grassland and threatened-community triggers that add seasons to a program (the sample site sits 39 m from a grassland reserve)
  • Heritage, flood, bushfire, soils, contamination: per-constraint, each with its own data status
  • Receptor separation: nearest dwellings, because cooling plant runs 24/7 and noise assessments look at every receptor in range

Coverage varies by state and the report says so per constraint: Victorian screens run with full layer coverage; in NSW the Aboriginal heritage register is access restricted and council flood mapping is partial, so those constraints are reported pending there, not assumed clear. This is a preliminary desktop screen to support early site selection; it is not planning advice, and it does not replace the specialist assessments a development application requires.

Field Guides

The homework, published.

The research behind this screen is free to read. Every guide below is built on real screens of real parcels and our national development application database.

849,000+ development applications tracked, refreshed daily
360+ councils covered, across every state and territory
8/8 states and territories live, not a single-state pilot

Every screen runs on the same live planning-data engine behind daleads.com.au, built and run by Bo Wang, a Monash-trained developer working in Australian PropTech.

No inflated case studies, no borrowed logos. The sample report on this page is a real screen you can read end to end, pending items and all.

Pricing

Priced like a filter, not a study.

A consultant desktop constraints study typically runs to five figures and takes weeks. This screen exists so you only commission those for sites that survive the first cut.

10-site credit pack

A$7,500 + GST
  • Screen a shortlist or an acquisition pipeline
  • Ranked side-by-side comparison across sites
  • Credits valid 12 months
  • Priority turnaround

Constraints that cannot be assessed from public data are disclosed as pending, never padded. If the screen returns materially less than the sample report shows for your state, we will say so before you pay.

Free instant teaser

Try it on your address first.

Type a candidate address and get a free sliver of the screen in seconds, straight from the same live database the paid report runs on: the planning zone at the point, development application activity around it, and what has been lodged nearby. The full 19-constraint screen with verdict and statutory references is the paid report.

Request the full screen

We'll get back to you as soon as we can with a sample section and confirmation. No payment now: we confirm scope first, then invoice at A$1,000 per site + GST.

Enter the site address in the box above.

7-day guarantee: if the report does not help you make the call, tell us within 7 days of delivery and we refund the full fee.

Prefer email? [email protected]

Have a shortlist?

Send one real candidate site.

Run the free teaser on your address, then request the screen. We reply with a sample section and scope confirmation as soon as we can.

Check your address free Read the sample first